<< Chapter < Page
  Introductory statistics     Page 34 / 36
Chapter >> Page >

14 . c. Iris

15 . c. Student's t

16 . b. is left-tailed.

17 . c. cluster sampling

18 . b. median

19 . a. the probability that an outcome of the data will happen purely by chance when the null hypothesis is true.

20 . d. stratified

21 . b. 25

22 . c. 4

23 . a. (1.85, 2.32)

24 . c. Both above are correct.

25 . c. 5.8

26 . c. 0.6321

27 . a. 0.8413

28 . a. (0.6030, 0.7954)

29 . a. N 145 14 10

30 . d. 3.66

31 . b. 5.1

32 . a. 13.46

33 . b. There is a strong linear pattern. Therefore, it is most likely a good model to be used.

34 . b. Chi 2 3 .

35 . d. 70

36 . b. There is sufficient evidence to conclude that the choice of major and the gender of the student are not independent of each other.

37 . a. Chi 2 goodness-of-fit

Practice final exam 2

1 . A study was done to determine the proportion of teenagers that own a car. The population proportion of teenagers that own a car is the:

  1. statistic.
  2. parameter.
  3. population.
  4. variable.


Use the following information to answer the next two exercises:

value frequency
0 1
1 4
2 7
3 9
6 4

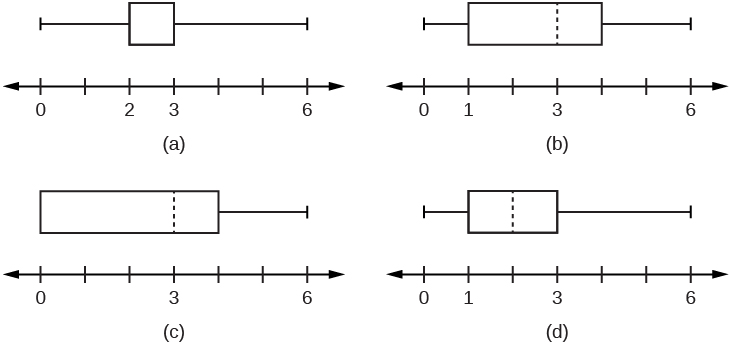
2 . The box plot for the data is:

This shows 4 boxplots, each over a number line scaled from 0 - 6. Boxplot (a) has left whisker from 0 to 2, box from 2 to 3, and right whisker from 3 to 6. Boxplot (b) has left whisker from 0 to 1, box from 1 to 4 with a dashed line at 3, and right whisker from 4 to 6. Boxplot (c) has box from 0 to 4 with a dashed line at 3 and right whisker from 4 to 6. Boxplot (d) has left whisker from 0 to 1, box from 1 to 3 with a dashed line at 2, and right whisker from 3 to 6.

3 . If six were added to each value of the data in the table, the 15 th percentile of the new list of values is:

  1. six
  2. one
  3. seven
  4. eight


Use the following information to answer the next two exercises: Suppose that the probability of a drought in any independent year is 20%. Out of those years in which a drought occurs, the probability of water rationing is ten percent. However, in any year, the probability of water rationing is five percent.

4 . What is the probability of both a drought and water rationing occurring?

  1. 0.05
  2. 0.01
  3. 0.02
  4. 0.30

5 . Which of the following is true?

  1. Drought and water rationing are independent events.
  2. Drought and water rationing are mutually exclusive events.
  3. None of the above


Use the following information to answer the next two exercises: Suppose that a survey yielded the following data:

Favorite pie
gender apple pumpkin pecan
female 40 10 30
male 20 30 10

6 . Suppose that one individual is randomly chosen. The probability that the person’s favorite pie is apple or the person is male is _____.

  1. 40 60
  2. 60 140
  3. 120 140
  4. 100 140

7 . Suppose H 0 is: Favorite pie and gender are independent. The p -value is ______.

  1. ≈ 0
  2. 1
  3. 0.05
  4. cannot be determined


Use the following information to answer the next two exercises: Let’s say that the probability that an adult watches the news at least once per week is 0.60. We randomly survey 14 people. Of interest is the number of people who watch the news at least once per week.

8 . Which of the following statements is FALSE?

  1. X ~ B (14 0.60)
  2. The values for x are: {1 ,2 ,3 ,... ,14}.
  3. μ = 8.4
  4. P ( X = 5) = 0.0408

9 . Find the probability that at least six adults watch the news at least once per week.

  1. 6 14
  2. 0.8499
  3. 0.9417
  4. 0.6429

10 . The following histogram is most likely to be a result of sampling from which distribution?
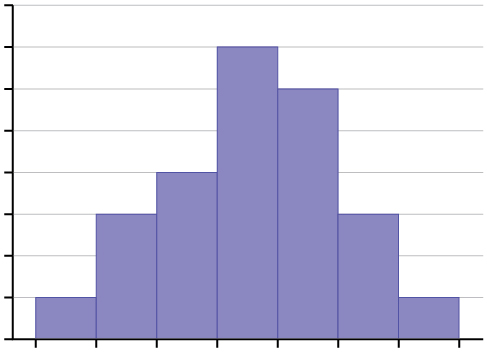
This graph is an unlabeled histogram. The distribution is roughly symmetric. There is a single peak in the center of the graph and heights of bars decrease from that point toward each end of the graph.
  1. chi-square with df = 6
  2. exponential
  3. uniform
  4. binomial

11 . The ages of campus day and evening students is known to be normally distributed. A sample of six campus day and evening students reported their ages (in years) as: {18, 35, 27, 45, 20, 20}. What is the error bound for the 90% confidence interval of the true average age?

  1. 11.2
  2. 22.3
  3. 17.5
  4. 8.7

Questions & Answers

what is phylogeny
Odigie Reply
evolutionary history and relationship of an organism or group of organisms
AI-Robot
ok
Deng
what is biology
Hajah Reply
the study of living organisms and their interactions with one another and their environments
AI-Robot
what is biology
Victoria Reply
HOW CAN MAN ORGAN FUNCTION
Alfred Reply
the diagram of the digestive system
Assiatu Reply
allimentary cannel
Ogenrwot
How does twins formed
William Reply
They formed in two ways first when one sperm and one egg are splited by mitosis or two sperm and two eggs join together
Oluwatobi
what is genetics
Josephine Reply
Genetics is the study of heredity
Misack
how does twins formed?
Misack
What is manual
Hassan Reply
discuss biological phenomenon and provide pieces of evidence to show that it was responsible for the formation of eukaryotic organelles
Joseph Reply
what is biology
Yousuf Reply
the study of living organisms and their interactions with one another and their environment.
Wine
discuss the biological phenomenon and provide pieces of evidence to show that it was responsible for the formation of eukaryotic organelles in an essay form
Joseph Reply
what is the blood cells
Shaker Reply
list any five characteristics of the blood cells
Shaker
lack electricity and its more savely than electronic microscope because its naturally by using of light
Abdullahi Reply
advantage of electronic microscope is easily and clearly while disadvantage is dangerous because its electronic. advantage of light microscope is savely and naturally by sun while disadvantage is not easily,means its not sharp and not clear
Abdullahi
cell theory state that every organisms composed of one or more cell,cell is the basic unit of life
Abdullahi
is like gone fail us
DENG
cells is the basic structure and functions of all living things
Ramadan
What is classification
ISCONT Reply
is organisms that are similar into groups called tara
Yamosa
in what situation (s) would be the use of a scanning electron microscope be ideal and why?
Kenna Reply
A scanning electron microscope (SEM) is ideal for situations requiring high-resolution imaging of surfaces. It is commonly used in materials science, biology, and geology to examine the topography and composition of samples at a nanoscale level. SEM is particularly useful for studying fine details,
Hilary
Got questions? Join the online conversation and get instant answers!
Jobilize.com Reply

Get Jobilize Job Search Mobile App in your pocket Now!

Get it on Google Play Download on the App Store Now


Source:  OpenStax, Introductory statistics. OpenStax CNX. May 06, 2016 Download for free at http://legacy.cnx.org/content/col11562/1.18
Google Play and the Google Play logo are trademarks of Google Inc.

Notification Switch

Would you like to follow the 'Introductory statistics' conversation and receive update notifications?

Ask