<< Chapter < Page Chapter >> Page >
This graph shows profits starting at 1985 at $10,000 and ending at 2005 at $4,000.  The x-axis ranges from 0 to 30 in intervals of 5 and the y –axis goes from 0 to 12,000 in intervals of 2,000.

Find the linear function y , where y depends on x , the number of years since 1980.

y = 3 00 x + 11 , 5 00

Got questions? Get instant answers now!

Find and interpret the y -intercept.

Got questions? Get instant answers now!

For the following exercise, consider this scenario: In 2004, a school population was 1,700. By 2012 the population had grown to 2,500.

Assume the population is changing linearly.

  1. How much did the population grow between the year 2004 and 2012?
  2. What is the average population growth per year?
  3. Find an equation for the population, P , of the school t years after 2004.

a) 800 b) 100 students per year c) P ( t ) = 1 00 t + 17 00

Got questions? Get instant answers now!

For the following exercises, consider this scenario: In 2000, the moose population in a park was measured to be 6,500. By 2010, the population was measured to be 12,500. Assume the population continues to change linearly.

Find a formula for the moose population, P .

Got questions? Get instant answers now!

What does your model predict the moose population to be in 2020?

18,500

Got questions? Get instant answers now!

For the following exercises, consider this scenario: The median home values in subdivisions Pima Central and East Valley (adjusted for inflation) are shown in [link] . Assume that the house values are changing linearly.

Year Pima Central East Valley
1970 32,000 120,250
2010 85,000 150,000

In which subdivision have home values increased at a higher rate?

Got questions? Get instant answers now!

If these trends were to continue, what would be the median home value in Pima Central in 2015?

$91,625

Got questions? Get instant answers now!

Fitting Linear Models to Data

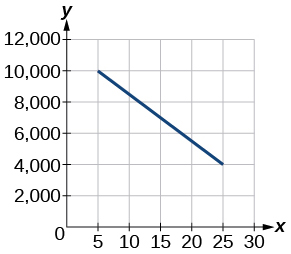
Draw a scatter plot for the data in [link] . Then determine whether the data appears to be linearly related.

0 2 4 6 8 10
–105 –50 1 55 105 160
Got questions? Get instant answers now!

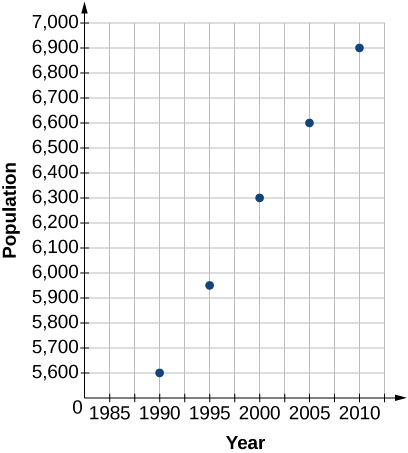
Draw a scatter plot for the data in [link] . If we wanted to know when the population would reach 15,000, would the answer involve interpolation or extrapolation?

Year Population
1990 5,600
1995 5,950
2000 6,300
2005 6,600
2010 6,900

Extrapolation


Scatter plot with the points (1990,5600); (1995,5950); (2000,6300); (2005,6600); and (2010,6900).

Got questions? Get instant answers now!

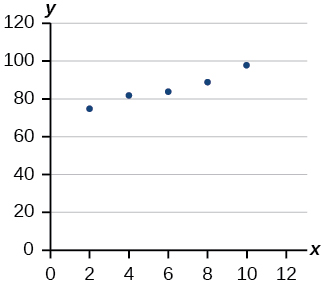
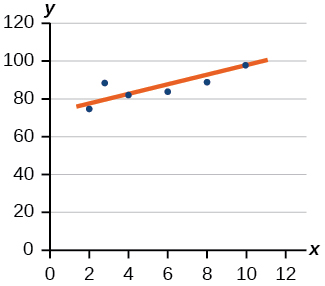
Eight students were asked to estimate their score on a 10-point quiz. Their estimated and actual scores are given in [link] . Plot the points, then sketch a line that fits the data.

Predicted Actual
6 6
7 7
7 8
8 8
7 9
9 10
10 10
10 9
Got questions? Get instant answers now!

Draw a best-fit line for the plotted data.

Scatter plot of the points: (2,78); (4,81); (6,85); (8,90); and (10,99).


Scatter plot of: (2,78); (4,81); (6,85); (8,90); and (10,99) and the line of best fit running through these points.  The line of best fit goes through most of the points.

Got questions? Get instant answers now!

For the following exercises, consider the data in [link] , which shows the percent of unemployed in a city of people 25 years or older who are college graduates is given below, by year.

Year 2000 2002 2005 2007 2010
Percent Graduates 6.5 7.0 7.4 8.2 9.0

Determine whether the trend appears to be linear. If so, and assuming the trend continues, find a linear regression model to predict the percent of unemployed in a given year to three decimal places.

Got questions? Get instant answers now!

In what year will the percentage exceed 12%?

2023

Got questions? Get instant answers now!

Based on the set of data given in [link] , calculate the regression line using a calculator or other technology tool, and determine the correlation coefficient to three decimal places.

x 17 20 23 26 29
y 15 25 31 37 40
Got questions? Get instant answers now!

Based on the set of data given in [link] , calculate the regression line using a calculator or other technology tool, and determine the correlation coefficient to three decimal places.

x 10 12 15 18 20
y 36 34 30 28 22

y = 1.294 x + 49.412 ;   r = 0.974

Got questions? Get instant answers now!

For the following exercises, consider this scenario: The population of a city increased steadily over a ten-year span. The following ordered pairs show the population and the year over the ten-year span (population, year) for specific recorded years:

Questions & Answers

it is the relatively stable flow of income
Chidubem Reply
what is circular flow of income
Divine Reply
branches of macroeconomics
SHEDRACK Reply
what is Flexible exchang rate?
poudel Reply
is gdp a reliable measurement of wealth
Atega Reply
introduction to econometrics
Husseini Reply
Hi
mostafa
hi
LEMLEM
hello
Sammol
hi
Mahesh
bi
Ruqayat
hi
Ruqayat
Hi fellas
Nyawa
hey
Sammol
hi
God
hello
Jahara
Good morning
Jorge
hi
abubakar
hi
Nmesoma
hi
Mahesh
Hi
Tom
Why is unemployment rate never zero at full employment?
Priyanka Reply
bcoz of existence of frictional unemployment in our economy.
Umashankar
what is flexible exchang rate?
poudel
due to existence of the pple with disabilities
Abdulraufu
the demand of a good rises, causing the demand for another good to fall
Rushawn Reply
is it possible to leave every good at the same level
Joseph
I don't think so. because check it, if the demand for chicken increases, people will no longer consume fish like they used to causing a fall in the demand for fish
Anuolu
is not really possible to let the value of a goods to be same at the same time.....
Salome
Suppose the inflation rate is 6%, does it mean that all the goods you purchase will cost 6% more than previous year? Provide with reasoning.
Geetha Reply
Not necessarily. To measure the inflation rate economists normally use an averaged price index of a basket of certain goods. So if you purchase goods included in the basket, you will notice that you pay 6% more, otherwise not necessarily.
Waeth
discus major problems of macroeconomics
Alii Reply
what is the problem of macroeconomics
Yoal
Economic growth Stable prices and low unemployment
Ephraim
explain inflationcause and itis degre
Miresa Reply
what is inflation
Getu
increase in general price levels
WEETO
Good day How do I calculate this question: C= 100+5yd G= 2000 T= 2000 I(planned)=200. Suppose the actual output is 3000. What is the level of planned expenditures at this level of output?
Chisomo Reply
how to calculate actual output?
Chisomo
how to calculate the equilibrium income
Beshir
Criteria for determining money supply
Thapase Reply
who we can define macroeconomics in one line
Muhammad
Aggregate demand
Mohammed
C=k100 +9y and i=k50.calculate the equilibrium level of output
Mercy Reply
Hi
Isiaka
Hi
Geli
hy
Man
👋
Bahunda
hy how are you?
Man
ys
Amisha
how are you guys
Sekou
f9 guys
Amisha
how are you guys
Sekou
ys am also fine
Amisha
fine and you guys
Geli
from Nepal
Amisha
nawalparasi district from belatari
Amisha
nd u
Amisha
I am Camara from Guinea west Africa... happy to meet you guys here
Sekou
ma management ho
Amisha
ahile becheclor ho
Amisha
hjr ktm bta ho ani k kaam grnu hunxa tw
Amisha
belatari
Amisha
1st year ho
Amisha
nd u
Amisha
ahh
Amisha
kaha biratnagar
Amisha
ys
Amisha
kina k vo
Amisha
money as unit of account means what?
Kalombe
A unit of account is something that can be used to value goods and services and make calculations
Jim
all of you please speak in English I can't understand you're language
Muhammad
I want to know how can we define macroeconomics in one line
Muhammad
it must be .9 or 0.9 no Mpc is greater than 1 Y=100+.9Y+50 Y-.9Y=150 0.1Y/0.1=150/0.1 Y=1500
Kalombe
Mercy is it clear?😋
Kalombe
hi can someone help me on this question If a negative shocks shifts the IS curve to the left, what type of policy do you suggest so as to stabilize the level of output? discuss your answer using appropriate graph.
Galge Reply
if interest rate is increased this will will reduce the level of income shifting the curve to the left ◀️
Kalombe
Got questions? Join the online conversation and get instant answers!
Jobilize.com Reply
Practice Key Terms 5

Get Jobilize Job Search Mobile App in your pocket Now!

Get it on Google Play Download on the App Store Now


Source:  OpenStax, Algebra and trigonometry. OpenStax CNX. Nov 14, 2016 Download for free at https://legacy.cnx.org/content/col11758/1.6
Google Play and the Google Play logo are trademarks of Google Inc.

Notification Switch

Would you like to follow the 'Algebra and trigonometry' conversation and receive update notifications?

Ask