<< Chapter < Page Chapter >> Page >

Using a regression line to make predictions

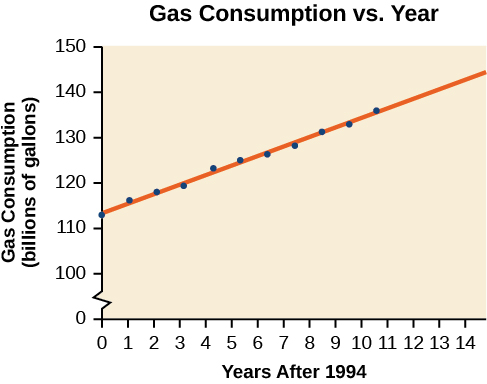
Gasoline consumption in the United States has been steadily increasing. Consumption data from 1994 to 2004 is shown in [link] . http://www.bts.gov/publications/national_transportation_statistics/2005/html/table_04_10.html Determine whether the trend is linear, and if so, find a model for the data. Use the model to predict the consumption in 2008.

Year '94 '95 '96 '97 '98 '99 '00 '01 '02 '03 '04
Consumption (billions of gallons) 113 116 118 119 123 125 126 128 131 133 136

The scatter plot of the data, including the least squares regression line, is shown in [link] .

Scatter plot, showing the line of best fit. It is titled 'Gas Consumption VS Year'. The x-axis is 'Year After 1994', and the y-axis is 'Gas Consumption (billions of gallons)'. The points are strongly positively correlated and the line of best fit goes through most of the points completely.

We can introduce new input variable, t , representing years since 1994.

The least squares regression equation is:

C ( t ) = 113.318 + 2.209 t

Using technology, the correlation coefficient was calculated to be 0.9965, suggesting a very strong increasing linear trend.

Using this to predict consumption in 2008 ( t = 14 ) ,

C ( 14 ) = 113.318 + 2.209 ( 14 )           = 144.244

The model predicts 144.244 billion gallons of gasoline consumption in 2008.

Got questions? Get instant answers now!

Use the model we created using technology in [link] to predict the gas consumption in 2011. Is this an interpolation or an extrapolation?

150.871 billion gallons; extrapolation

Got questions? Get instant answers now!

Access these online resources for additional instruction and practice with fitting linear models to data.

Key concepts

  • Scatter plots show the relationship between two sets of data. See [link] .
  • Scatter plots may represent linear or non-linear models.
  • The line of best fit may be estimated or calculated, using a calculator or statistical software. See [link] .
  • Interpolation can be used to predict values inside the domain and range of the data, whereas extrapolation can be used to predict values outside the domain and range of the data. See [link] .
  • The correlation coefficient, r , indicates the degree of linear relationship between data. See [link] .
  • A regression line best fits the data. See [link] .
  • The least squares regression line is found by minimizing the squares of the distances of points from a line passing through the data and may be used to make predictions regarding either of the variables. See [link] .

Section exercises

Verbal

Describe what it means if there is a model breakdown when using a linear model.

When our model no longer applies, after some value in the domain, the model itself doesn’t hold.

Got questions? Get instant answers now!

What is interpolation when using a linear model?

Got questions? Get instant answers now!

What is extrapolation when using a linear model?

We predict a value outside the domain and range of the data.

Got questions? Get instant answers now!

Explain the difference between a positive and a negative correlation coefficient.

Got questions? Get instant answers now!

Explain how to interpret the absolute value of a correlation coefficient.

The closer the number is to 1, the less scattered the data, the closer the number is to 0, the more scattered the data.

Got questions? Get instant answers now!

Algebraic

A regression was run to determine whether there is a relationship between hours of TV watched per day ( x ) and number of sit-ups a person can do ( y ) . The results of the regression are given below. Use this to predict the number of sit-ups a person who watches 11 hours of TV can do.

y = a x + b a = −1.341 b = 32.234   r = −0.896
Got questions? Get instant answers now!

Questions & Answers

what does mean opportunity cost?
Aster Reply
what is poetive effect of population growth
Solomon Reply
what is inflation
Nasir Reply
what is demand
Eleni
what is economics
IMLAN Reply
economics theory describes individual behavior as the result of a process of optimization under constraints the objective to be reached being determined by
Kalkidan
Economics is a branch of social science that deal with How to wise use of resource ,s
Kassie
need
WARKISA
Economic Needs: In economics, needs are goods or services that are necessary for maintaining a certain standard of living. This includes things like healthcare, education, and transportation.
Kalkidan
What is demand and supply
EMPEROR Reply
deman means?
Alex
what is supply?
Alex
ex play supply?
Alex
Money market is a branch or segment of financial market where short-term debt instruments are traded upon. The instruments in this market includes Treasury bills, Bonds, Commercial Papers, Call money among other.
murana Reply
good
Kayode
what is money market
umar Reply
Examine the distinction between theory of comparative cost Advantage and theory of factor proportion
Fatima Reply
What is inflation
Bright Reply
a general and ongoing rise in the level of prices in an economy
AI-Robot
What are the factors that affect demand for a commodity
Florence Reply
price
Kenu
differentiate between demand and supply giving examples
Lambiv Reply
differentiated between demand and supply using examples
Lambiv
what is labour ?
Lambiv
how will I do?
Venny Reply
how is the graph works?I don't fully understand
Rezat Reply
information
Eliyee
devaluation
Eliyee
t
WARKISA
hi guys good evening to all
Lambiv
multiple choice question
Aster Reply
appreciation
Eliyee
explain perfect market
Lindiwe Reply
In economics, a perfect market refers to a theoretical construct where all participants have perfect information, goods are homogenous, there are no barriers to entry or exit, and prices are determined solely by supply and demand. It's an idealized model used for analysis,
Ezea
Got questions? Join the online conversation and get instant answers!
Jobilize.com Reply
Practice Key Terms 5

Get Jobilize Job Search Mobile App in your pocket Now!

Get it on Google Play Download on the App Store Now


Source:  OpenStax, Algebra and trigonometry. OpenStax CNX. Nov 14, 2016 Download for free at https://legacy.cnx.org/content/col11758/1.6
Google Play and the Google Play logo are trademarks of Google Inc.

Notification Switch

Would you like to follow the 'Algebra and trigonometry' conversation and receive update notifications?

Ask