| << Chapter < Page | Chapter >> Page > |
A third method of representing a linear function is through the use of a table. The relationship between the distance from the station and the time is represented in [link] . From the table, we can see that the distance changes by 83 meters for every 1 second increase in time.

Can the input in the previous example be any real number?
No. The input represents time so while nonnegative rational and irrational numbers are possible, negative real numbers are not possible for this example. The input consists of non-negative real numbers.
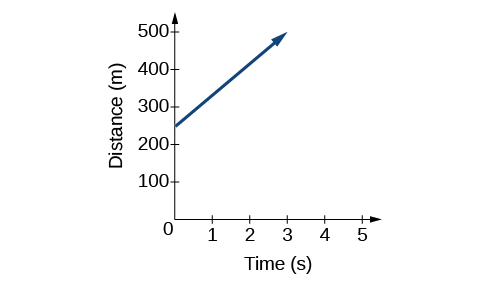
Another way to represent linear functions is visually, using a graph. We can use the function relationship from above, to draw a graph as represented in [link] . Notice the graph is a line . When we plot a linear function, the graph is always a line.
The rate of change, which is constant, determines the slant, or slope of the line. The point at which the input value is zero is the vertical intercept, or y -intercept , of the line. We can see from the graph that the y -intercept in the train example we just saw is and represents the distance of the train from the station when it began moving at a constant speed.

Notice that the graph of the train example is restricted, but this is not always the case. Consider the graph of the line Ask yourself what numbers can be input to the function. In other words, what is the domain of the function? The domain is comprised of all real numbers because any number may be doubled, and then have one added to the product.
A linear function is a function whose graph is a line. Linear functions can be written in the slope-intercept form of a line
where is the initial or starting value of the function (when input, ), and is the constant rate of change, or slope of the function. The y -intercept is at
The pressure, in pounds per square inch (PSI) on the diver in [link] depends upon her depth below the water surface, in feet. This relationship may be modeled by the equation, Restate this function in words.

To restate the function in words, we need to describe each part of the equation. The pressure as a function of depth equals four hundred thirty-four thousandths times depth plus fourteen and six hundred ninety-six thousandths.
The linear functions we used in the two previous examples increased over time, but not every linear function does. A linear function may be increasing, decreasing, or constant. For an increasing function , as with the train example, the output values increase as the input values increase. The graph of an increasing function has a positive slope. A line with a positive slope slants upward from left to right as in [link] (a) . For a decreasing function , the slope is negative. The output values decrease as the input values increase. A line with a negative slope slants downward from left to right as in [link] (b) . If the function is constant, the output values are the same for all input values so the slope is zero. A line with a slope of zero is horizontal as in [link] (c) .

Notification Switch
Would you like to follow the 'Algebra and trigonometry' conversation and receive update notifications?