| << Chapter < Page | Chapter >> Page > |
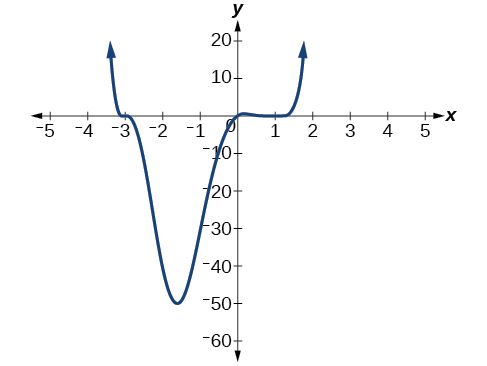
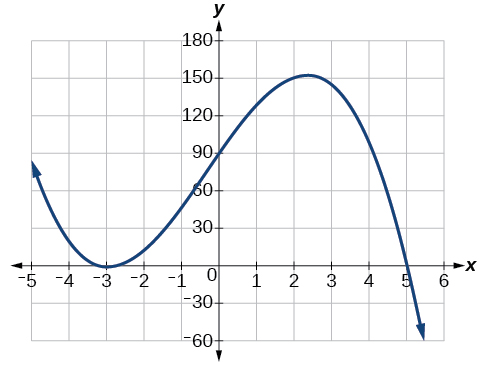
Sketch a graph of
This graph has two x -intercepts. At the factor is squared, indicating a multiplicity of 2. The graph will bounce at this x -intercept. At the function has a multiplicity of one, indicating the graph will cross through the axis at this intercept.
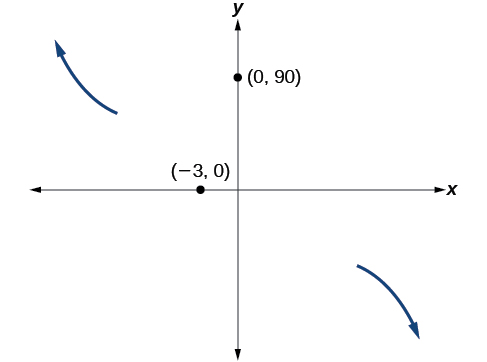
The y -intercept is found by evaluating
The y -intercept is
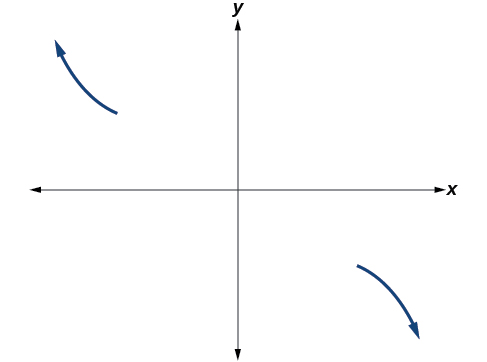
Additionally, we can see the leading term, if this polynomial were multiplied out, would be so the end behavior is that of a vertically reflected cubic, with the outputs decreasing as the inputs approach infinity, and the outputs increasing as the inputs approach negative infinity. See [link] .
To sketch this, we consider that:
At the graph crosses the y -axis at the y -intercept. See [link] .
Somewhere after this point, the graph must turn back down or start decreasing toward the horizontal axis because the graph passes through the next intercept at See [link] .
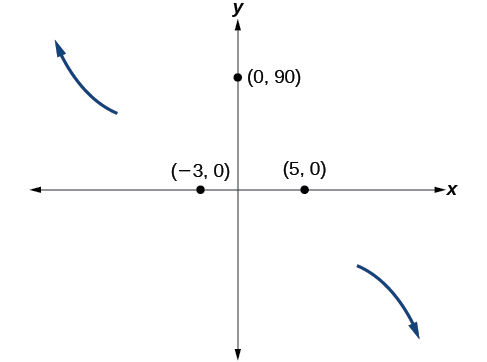
As the function so we know the graph continues to decrease, and we can stop drawing the graph in the fourth quadrant.
Using technology, we can create the graph for the polynomial function, shown in [link] , and verify that the resulting graph looks like our sketch in [link] .
In some situations, we may know two points on a graph but not the zeros. If those two points are on opposite sides of the x -axis, we can confirm that there is a zero between them. Consider a polynomial function whose graph is smooth and continuous. The Intermediate Value Theorem states that for two numbers and in the domain of if and then the function takes on every value between and (While the theorem is intuitive, the proof is actually quite complicated and requires higher mathematics.) We can apply this theorem to a special case that is useful in graphing polynomial functions. If a point on the graph of a continuous function at lies above the axis and another point at lies below the axis, there must exist a third point between and where the graph crosses the axis. Call this point This means that we are assured there is a solution where
In other words, the Intermediate Value Theorem tells us that when a polynomial function changes from a negative value to a positive value, the function must cross the axis. [link] shows that there is a zero between and
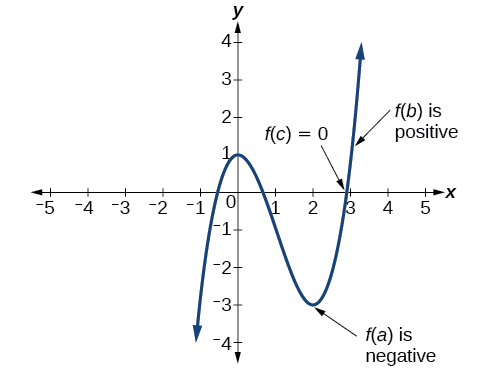
Let be a polynomial function. The Intermediate Value Theorem states that if and have opposite signs, then there exists at least one value between and for which
Notification Switch
Would you like to follow the 'Algebra and trigonometry' conversation and receive update notifications?

|
|
|
|
|

|
|

|
|

|
|

|
|

|
|

|
|

|
|

|
|

|
|

|