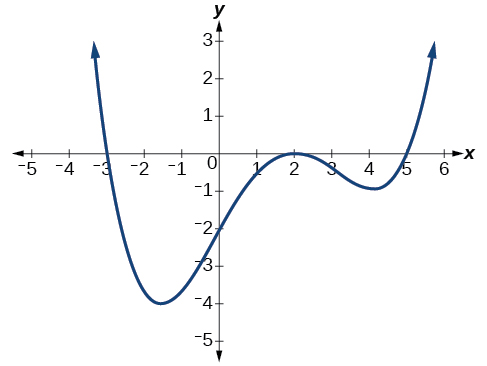
Show that the function
has at least two real zeros between
and
As a start, evaluate
at the integer values
and
See
[link] .
1
2
3
4
5
0
–3
2
We see that one zero occurs at
Also, since
is negative and
is positive, by the Intermediate Value Theorem, there must be at least one real zero between 3 and 4.
We have shown that there are at least two real zeros between
and
Now that we know how to find zeros of polynomial functions, we can use them to write formulas based on graphs. Because a
polynomial function written in factored form will have an
x -intercept where each factor is equal to zero, we can form a function that will pass through a set of
x -intercepts by introducing a corresponding set of factors.
Factored form of polynomials
If a polynomial of lowest degree
has horizontal intercepts at
then the polynomial can be written in the factored form:
where the powers
on each factor can be determined by the behavior of the graph at the corresponding intercept, and the stretch factor
can be determined given a value of the function other than the
x -intercept.
Given a graph of a polynomial function, write a formula for the function.
Identify the
x -intercepts of the graph to find the factors of the polynomial.
Examine the behavior of the graph at the
x -intercepts to determine the multiplicity of each factor.
Find the polynomial of least degree containing all the factors found in the previous step.
Use any other point on the graph (the
y -intercept may be easiest) to determine the stretch factor.
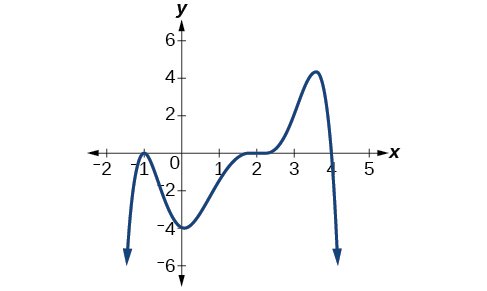
Writing a formula for a polynomial function from the graph
Write a formula for the polynomial function shown in
[link] .
This graph has three
x -intercepts:
and
The
y -intercept is located at
At
and
the graph passes through the axis linearly, suggesting the corresponding factors of the polynomial will be linear. At
the graph bounces at the intercept, suggesting the corresponding factor of the polynomial will be second degree (quadratic). Together, this gives us
To determine the stretch factor, we utilize another point on the graph. We will use the
intercept
to solve for
The graphed polynomial appears to represent the function
With quadratics, we were able to algebraically find the maximum or minimum value of the function by finding the vertex. For general polynomials, finding these turning points is not possible without more advanced techniques from calculus. Even then, finding where extrema occur can still be algebraically challenging. For now, we will estimate the locations of turning points using technology to generate a graph.
Step 1: Find the mean. To find the mean, add up all the scores, then divide them by the number of scores. ...
Step 2: Find each score's deviation from the mean. ...
Step 3: Square each deviation from the mean. ...
Step 4: Find the sum of squares. ...
Step 5: Divide the sum of squares by n – 1 or N.
The sample of 16 students is taken. The average age in the sample was 22 years with astandard deviation of 6 years. Construct a 95% confidence interval for the age of the population.
Bhartdarshan' is an internet-based travel agency wherein customer can see videos of the cities they plant to visit. The number of hits daily is a normally distributed random variable with a mean of 10,000 and a standard deviation of 2,400
a. what is the probability of getting more than 12,000 hits?
b. what is the probability of getting fewer than 9,000 hits?
Bhartdarshan'is an internet-based travel agency wherein customer can see videos of the cities they plan to visit. The number of hits daily is a normally distributed random variable with a mean of 10,000 and a standard deviation of 2,400.
a. What is the probability of getting more than 12,000 hits