

| << Chapter < Page | Chapter >> Page > |
Now, how can we define what is the “normal return to capital ?” This is a very simple, important and often misunderstood aspect of economic theory.
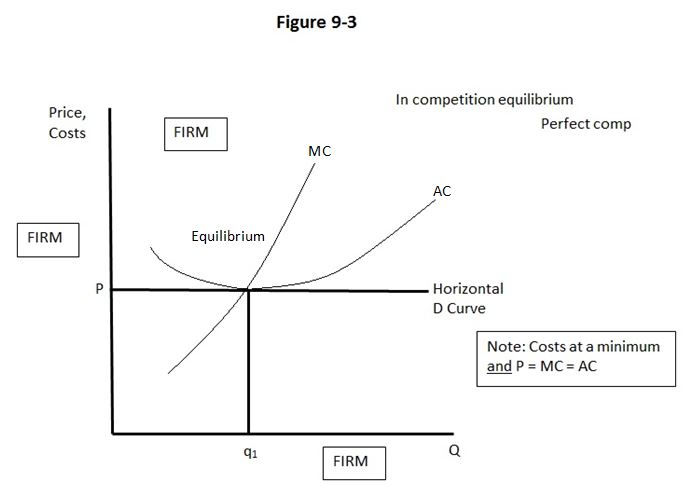
Again consider what a cost curve means in economics. Consider a long-term cost curves for a firm , in a perfectly competitive industry.
Answer: Labor costs, material costs, land costs and a “normal” return to capital (perhaps 5.5% in 2012).
In L.R, a firm must cover all these costs, or it will go belly-up.
How do we define a “normal” return to capital?
The normal return to capital is the opportunity cost of capital. This is the minimum payment capital must receive to be supplied to a firm, or to an industry, or to the economy otherwise capital will go elsewhere.
Normal return then: what capital can earn in its alternate uses, combined with labor.
Another way of putting it: normal return to capital is an average return to investments in activities with “ average ” risks.
Note: Labor can receive rents too. (What is Quarterback Peyton Manning’s opportunity cost (value in next best case use)? He might earn $200K as a banker. He earns at least $20 million per year in pro football. The excess of his football salary over his value in his next best use is rent .
Normal returns to capital are not necessarily constant over time. In fact, they can vary depending on economic conditions.
Example: Reduced national savings makes capital scarcer, this tends to drive up the normal return to capital.
Increased demand for investment capital may also drive up capital’s normal return across the economy, and the world.
Again, in L.R. run, under assumptions of perfect competition , the return to all capital owners is just the normal return to capital. There are no permanent rents aside from natural resource rents, no economic profits .
How can this be?
Rents, or economic profits are competed away . With free entry and exit of firms into all industries, this must happen, under competition.
Digression:
Note: I said earlier that in U.S. average real returns to capital in recent years have been about 6%
Was perhaps 8% in mid-nineties. 7% in late nineties (dot.com boom) Maybe 5.5% in 2013.
Of course real returns to capital in emerging nations are higher. Why is that?
But also real returns to capital may be as much as 20% in even middle income emerging nations. This figure reflects two other things.
Now come back to the diagram.
Consider again an industry under competition. Say the shoe industry. Let this be in L.R a constant cost industry.
Again- what is a constant cost industry?
An industry that uses no specialized factors of production. So, expansion or contraction of output of that industry will itself have no effect on the prices it pays for its inputs .
Notification Switch
Would you like to follow the 'Economic development for the 21st century' conversation and receive update notifications?

|
|

|
|

|
|

|
|

|
|

|
|

|
|
|
|
|

|
|

|