<< Chapter < Page Chapter >> Page >

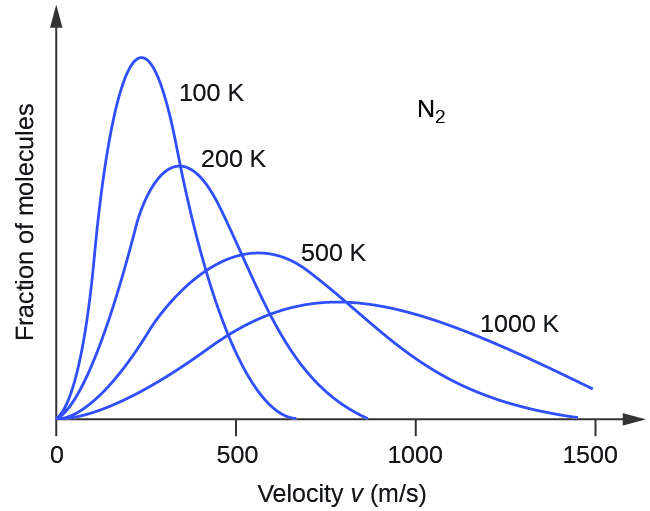
If the temperature of a gas increases, its KE avg increases, more molecules have higher speeds and fewer molecules have lower speeds, and the distribution shifts toward higher speeds overall, that is, to the right. If temperature decreases, KE avg decreases, more molecules have lower speeds and fewer molecules have higher speeds, and the distribution shifts toward lower speeds overall, that is, to the left. This behavior is illustrated for nitrogen gas in [link] .

A graph with four positively or right-skewed curves of varying heights is shown. The horizontal axis is labeled, “Velocity v ( m divided by s ).” This axis is marked by increments of 500 beginning at 0 and extending up to 1500. The vertical axis is labeled, “Fraction of molecules.” The label, “N subscript 2,” appears in the open space in the upper right area of the graph. The tallest and narrowest of these curves is labeled, “100 K.” Its right end appears to touch the horizontal axis around 700 m per s. It is followed by a slightly wider curve which is labeled, “200 K,” that is about three quarters of the height of the initial curve. Its right end appears to touch the horizontal axis around 850 m per s. The third curve is significantly wider and only about half the height of the initial curve. It is labeled, “500 K.” Its right end appears to touch the horizontal axis around 1450 m per s. The final curve is only about one third the height of the initial curve. It is much wider than the others, so much so that its right end has not yet reached the horizontal axis. This curve is labeled, “1000 K.”
The molecular speed distribution for nitrogen gas (N 2 ) shifts to the right and flattens as the temperature increases; it shifts to the left and heightens as the temperature decreases.

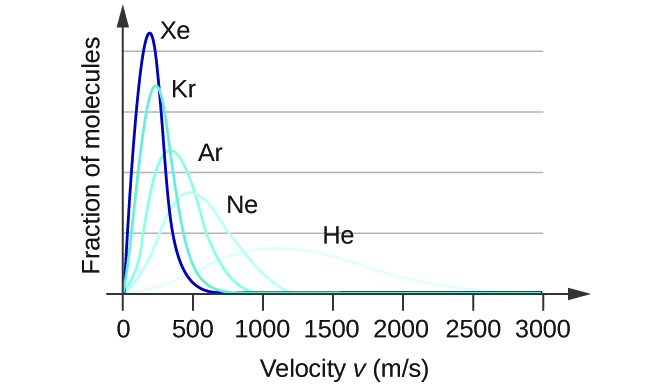
At a given temperature, all gases have the same KE avg for their molecules. Gases composed of lighter molecules have more high-speed particles and a higher u rms , with a speed distribution that peaks at relatively higher velocities. Gases consisting of heavier molecules have more low-speed particles, a lower u rms , and a speed distribution that peaks at relatively lower velocities. This trend is demonstrated by the data for a series of noble gases shown in [link] .

A graph is shown with four positively or right-skewed curves of varying heights. The horizontal axis is labeled, “Velocity v ( m divided by s ).” This axis is marked by increments of 500 beginning at 0 and extending up to 3000. The vertical axis is labeled, “Fraction of molecules.” The tallest and narrowest of these curves is labeled, “X e.” Its right end appears to touch the horizontal axis around 600 m per s. It is followed by a slightly wider curve which is labeled, “A r,” that is about half the height of the initial curve. Its right end appears to touch the horizontal axis around 900 m per s. The third curve is significantly wider and just over a third of the height of the initial curve. It is labeled, “N e.” Its right end appears to touch the horizontal axis around 1200 m per s. The final curve is only about one fourth the height of the initial curve. It is much wider than the others, so much so that its right reaches the horizontal axis around 2500 m per s. This curve is labeled, “H e.”
Molecular velocity is directly related to molecular mass. At a given temperature, lighter molecules move faster on average than heavier molecules.

The kinetic-molecular theory explains the behavior of gases, part ii

According to Graham’s law, the molecules of a gas are in rapid motion and the molecules themselves are small. The average distance between the molecules of a gas is large compared to the size of the molecules. As a consequence, gas molecules can move past each other easily and diffuse at relatively fast rates.

The rate of effusion of a gas depends directly on the (average) speed of its molecules:

effusion rate u rms

Using this relation, and the equation relating molecular speed to mass, Graham’s law may be easily derived as shown here:

u rms = 3 R T m
m = 3 R T u r m s 2 = 3 R T u ¯ 2
effusion rate A effusion rate B = u r m s A u r m s B = 3 R T m A 3 R T m B = m B m A

The ratio of the rates of effusion is thus derived to be inversely proportional to the ratio of the square roots of their masses. This is the same relation observed experimentally and expressed as Graham’s law.

Key concepts and summary

The kinetic molecular theory is a simple but very effective model that effectively explains ideal gas behavior. The theory assumes that gases consist of widely separated molecules of negligible volume that are in constant motion, colliding elastically with one another and the walls of their container with average velocities determined by their absolute temperatures. The individual molecules of a gas exhibit a range of velocities, the distribution of these velocities being dependent on the temperature of the gas and the mass of its molecules.

Key equations

  • u r m s = u 2 ¯ = u 1 2 + u 2 2 + u 3 2 + u 4 2 + n
  • KE avg = 3 2 R T
  • u rms = 3 R T m

Questions & Answers

start new n questions too
Emmaunella Reply
summarize halerambos & holbon
David Reply
the Three stages of Auguste Comte
Clementina Reply
what are agents of socialization
Antonio Reply
sociology of education
Nuhu Reply
definition of sociology of education
Nuhu
definition of sociology of education
Emmaunella
what is culture
Abdulrahim Reply
shared beliefs, values, and practices
AI-Robot
What are the two type of scientific method
ogunniran Reply
I'm willing to join you
Aceng Reply
what are the scientific method of sociology
Man
what is socialization
ogunniran Reply
the process wherein people come to understand societal norms and expectations, to accept society's beliefs, and to be aware of societal values
AI-Robot
scientific method in doing research
ogunniran
defimition of sickness in afica
Anita
Cosmology
ogunniran
Hmmm
ogunniran
list and explain the terms that found in society
REMMY Reply
list and explain the terms that found in society
Mukhtar
what are the agents of socialization
Antonio
Family Peer group Institution
Abdulwajud
I mean the definition
Antonio
ways of perceived deviance indifferent society
Naomi Reply
reasons of joining groups
SAM
to bring development to the nation at large
Hyellafiya
entails of consultative and consensus building from others
Gadama
World first Sociologist?
Abu
What is evolutionary model
Muhammad Reply
Evolution models refer to mathematical and computational representations of the processes involved in biological evolution. These models aim to simulate and understand how species change over time through mechanisms such as natural selection, genetic drift, and mutation. Evolutionary models can be u
faruk
what are the modern trends in religious behaviours
Selekeye Reply
what are social norms
Daniel Reply
shared standards of acceptable behavior by the group or appropriate behavior in a particular institution or those behaviors that are acceptable in a society
Lucius
that is how i understood it
Lucius
examples of societal norms
Diamond
Discuss the characteristics of the research located within positivist and the interpretivist paradigm
Tariro Reply
Got questions? Join the online conversation and get instant answers!
Jobilize.com Reply
Practice Key Terms 2

Get Jobilize Job Search Mobile App in your pocket Now!

Get it on Google Play Download on the App Store Now


Source:  OpenStax, Chemistry. OpenStax CNX. May 20, 2015 Download for free at http://legacy.cnx.org/content/col11760/1.9
Google Play and the Google Play logo are trademarks of Google Inc.

Notification Switch

Would you like to follow the 'Chemistry' conversation and receive update notifications?

Ask