<< Chapter < Page Chapter >> Page >

Molecular orbital energy diagrams

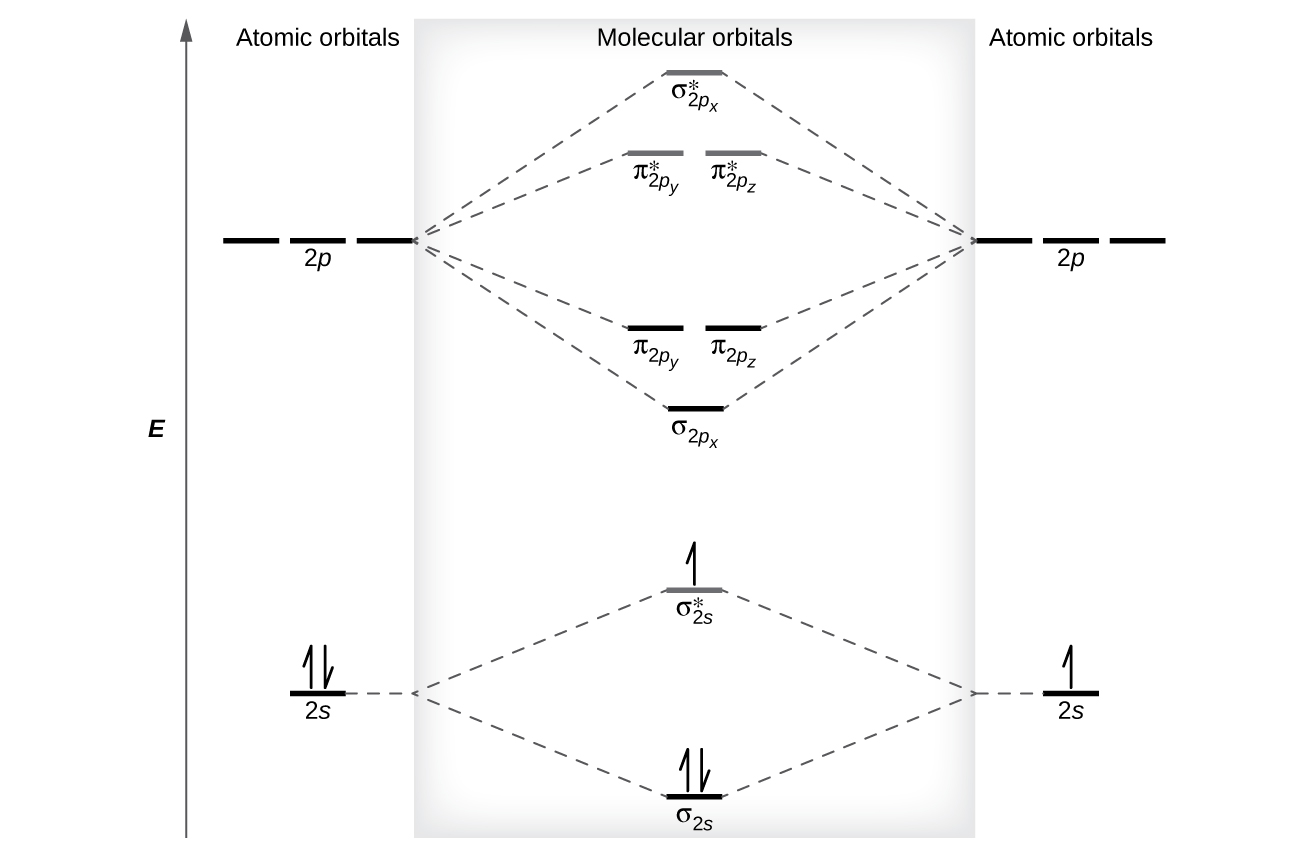
The relative energy levels of atomic and molecular orbitals are typically shown in a molecular orbital diagram    ( [link] ). For a diatomic molecule, the atomic orbitals of one atom are shown on the left, and those of the other atom are shown on the right. Each horizontal line represents one orbital that can hold two electrons. The molecular orbitals formed by the combination of the atomic orbitals are shown in the center. Dashed lines show which of the atomic orbitals combine to form the molecular orbitals. For each pair of atomic orbitals that combine, one lower-energy (bonding) molecular orbital and one higher-energy (antibonding) orbital result. Thus we can see that combining the six 2 p atomic orbitals results in three bonding orbitals (one σ and two π) and three antibonding orbitals (one σ* and two π*).

We predict the distribution of electrons in these molecular orbitals by filling the orbitals in the same way that we fill atomic orbitals, by the Aufbau principle. Lower-energy orbitals fill first, electrons spread out among degenerate orbitals before pairing, and each orbital can hold a maximum of two electrons with opposite spins ( [link] ). Just as we write electron configurations for atoms, we can write the molecular electronic configuration by listing the orbitals with superscripts indicating the number of electrons present. For clarity, we place parentheses around molecular orbitals with the same energy. In this case, each orbital is at a different energy, so parentheses separate each orbital. Thus we would expect a diatomic molecule or ion containing seven electrons (such as Be 2 + ) would have the molecular electron configuration ( σ 1 s ) 2 ( σ 1 s * ) 2 ( σ 2 s ) 2 ( σ 2 s * ) 1 . It is common to omit the core electrons from molecular orbital diagrams and configurations and include only the valence electrons.

A diagram is shown that has an upward-facing vertical arrow running along the left side labeled, “E.” At the bottom center of the diagram is a horizontal line labeled, “sigma subscript 2 s,” that has two vertical half arrows drawn on it, one facing up and one facing down. This line is connected to the right and left by upward-facing, dotted lines to two more horizontal lines, each labeled, “2 s.” The line on the left has two vertical half arrows drawn on it, one facing up and one facing down while the line of the right has one half arrow facing up drawn on it. These two lines are connected by upward-facing dotted lines to another line in the center of the diagram, but further up from the first. It is labeled, “sigma subscript 2 s superscript asterisk.” This horizontal line has one upward-facing vertical half-arrow drawn on it. Moving farther up the center of the diagram is a long horizontal line labeled, “sigma subscript 2 p subscript x,” which lies below two horizontal lines. These two horizontal lines lie side-by-side, and labeled, “pi subscript 2 p subscript y,” and, “pi subscript 2 p subscript z.” Both the bottom and top lines are connected to the right and left by upward-facing, dotted lines to three more horizontal lines, each labeled, “2 p.” These sets of lines are connected by upward-facing dotted lines to another single line and then pair of double lines in the center of the diagram, but farther up from the lower lines. They are labeled, “sigma subscript 2 p subscript x superscript asterisk,” and, ““pi subscript 2 p subscript y superscript asterisk,” and, “pi subscript 2 p subscript z superscript asterisk,” respectively. The left and right sides of the diagram have headers that read, ”Atomic orbitals,” while the center is header reads “Molecular orbitals”.
This is the molecular orbital diagram for the homonuclear diatomic Be 2 + , showing the molecular orbitals of the valence shell only. The molecular orbitals are filled in the same manner as atomic orbitals, using the Aufbau principle and Hund’s rule.

Bond order

The filled molecular orbital diagram shows the number of electrons in both bonding and antibonding molecular orbitals. The net contribution of the electrons to the bond strength of a molecule is identified by determining the bond order    that results from the filling of the molecular orbitals by electrons.

When using Lewis structures to describe the distribution of electrons in molecules, we define bond order as the number of bonding pairs of electrons between two atoms. Thus a single bond has a bond order of 1, a double bond has a bond order of 2, and a triple bond has a bond order of 3. We define bond order differently when we use the molecular orbital description of the distribution of electrons, but the resulting bond order is usually the same. The MO technique is more accurate and can handle cases when the Lewis structure method fails, but both methods describe the same phenomenon.

In the molecular orbital model, an electron contributes to a bonding interaction if it occupies a bonding orbital and it contributes to an antibonding interaction if it occupies an antibonding orbital. The bond order is calculated by subtracting the destabilizing (antibonding) electrons from the stabilizing (bonding) electrons. Since a bond consists of two electrons, we divide by two to get the bond order. We can determine bond order with the following equation:

Questions & Answers

what does mean opportunity cost?
Aster Reply
what is poetive effect of population growth
Solomon Reply
what is inflation
Nasir Reply
what is demand
Eleni
what is economics
IMLAN Reply
economics theory describes individual behavior as the result of a process of optimization under constraints the objective to be reached being determined by
Kalkidan
Economics is a branch of social science that deal with How to wise use of resource ,s
Kassie
need
WARKISA
Economic Needs: In economics, needs are goods or services that are necessary for maintaining a certain standard of living. This includes things like healthcare, education, and transportation.
Kalkidan
What is demand and supply
EMPEROR Reply
deman means?
Alex
what is supply?
Alex
ex play supply?
Alex
Money market is a branch or segment of financial market where short-term debt instruments are traded upon. The instruments in this market includes Treasury bills, Bonds, Commercial Papers, Call money among other.
murana Reply
good
Kayode
what is money market
umar Reply
Examine the distinction between theory of comparative cost Advantage and theory of factor proportion
Fatima Reply
What is inflation
Bright Reply
a general and ongoing rise in the level of prices in an economy
AI-Robot
What are the factors that affect demand for a commodity
Florence Reply
price
Kenu
differentiate between demand and supply giving examples
Lambiv Reply
differentiated between demand and supply using examples
Lambiv
what is labour ?
Lambiv
how will I do?
Venny Reply
how is the graph works?I don't fully understand
Rezat Reply
information
Eliyee
devaluation
Eliyee
t
WARKISA
hi guys good evening to all
Lambiv
multiple choice question
Aster Reply
appreciation
Eliyee
explain perfect market
Lindiwe Reply
In economics, a perfect market refers to a theoretical construct where all participants have perfect information, goods are homogenous, there are no barriers to entry or exit, and prices are determined solely by supply and demand. It's an idealized model used for analysis,
Ezea
Got questions? Join the online conversation and get instant answers!
Jobilize.com Reply

Get Jobilize Job Search Mobile App in your pocket Now!

Get it on Google Play Download on the App Store Now


Source:  OpenStax, Chemistry. OpenStax CNX. May 20, 2015 Download for free at http://legacy.cnx.org/content/col11760/1.9
Google Play and the Google Play logo are trademarks of Google Inc.

Notification Switch

Would you like to follow the 'Chemistry' conversation and receive update notifications?

Ask