<< Chapter < Page Chapter >> Page >

Using a regression line to make predictions

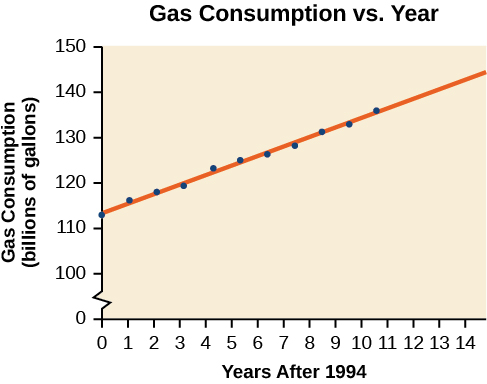
Gasoline consumption in the United States has been steadily increasing. Consumption data from 1994 to 2004 is shown in [link] . http://www.bts.gov/publications/national_transportation_statistics/2005/html/table_04_10.html Determine whether the trend is linear, and if so, find a model for the data. Use the model to predict the consumption in 2008.

Year '94 '95 '96 '97 '98 '99 '00 '01 '02 '03 '04
Consumption (billions of gallons) 113 116 118 119 123 125 126 128 131 133 136

The scatter plot of the data, including the least squares regression line, is shown in [link] .

Scatter plot, showing the line of best fit. It is titled 'Gas Consumption VS Year'. The x-axis is 'Year After 1994', and the y-axis is 'Gas Consumption (billions of gallons)'. The points are strongly positively correlated and the line of best fit goes through most of the points completely.

We can introduce new input variable, t , representing years since 1994.

The least squares regression equation is:

C ( t ) = 113.318 + 2.209 t

Using technology, the correlation coefficient was calculated to be 0.9965, suggesting a very strong increasing linear trend.

Using this to predict consumption in 2008 ( t = 14 ) ,

C ( 14 ) = 113.318 + 2.209 ( 14 )           = 144.244

The model predicts 144.244 billion gallons of gasoline consumption in 2008.

Got questions? Get instant answers now!

Use the model we created using technology in [link] to predict the gas consumption in 2011. Is this an interpolation or an extrapolation?

150.871 billion gallons; extrapolation

Got questions? Get instant answers now!

Access these online resources for additional instruction and practice with fitting linear models to data.

Key concepts

  • Scatter plots show the relationship between two sets of data. See [link] .
  • Scatter plots may represent linear or non-linear models.
  • The line of best fit may be estimated or calculated, using a calculator or statistical software. See [link] .
  • Interpolation can be used to predict values inside the domain and range of the data, whereas extrapolation can be used to predict values outside the domain and range of the data. See [link] .
  • The correlation coefficient, r , indicates the degree of linear relationship between data. See [link] .
  • A regression line best fits the data. See [link] .
  • The least squares regression line is found by minimizing the squares of the distances of points from a line passing through the data and may be used to make predictions regarding either of the variables. See [link] .

Section exercises

Verbal

Describe what it means if there is a model breakdown when using a linear model.

When our model no longer applies, after some value in the domain, the model itself doesn’t hold.

Got questions? Get instant answers now!

What is interpolation when using a linear model?

Got questions? Get instant answers now!

What is extrapolation when using a linear model?

We predict a value outside the domain and range of the data.

Got questions? Get instant answers now!

Explain the difference between a positive and a negative correlation coefficient.

Got questions? Get instant answers now!

Explain how to interpret the absolute value of a correlation coefficient.

The closer the number is to 1, the less scattered the data, the closer the number is to 0, the more scattered the data.

Got questions? Get instant answers now!

Algebraic

A regression was run to determine whether there is a relationship between hours of TV watched per day ( x ) and number of sit-ups a person can do ( y ) . The results of the regression are given below. Use this to predict the number of sit-ups a person who watches 11 hours of TV can do.

y = a x + b a = −1.341 b = 32.234   r = −0.896
Got questions? Get instant answers now!

Questions & Answers

summarize halerambos & holbon
David Reply
the Three stages of Auguste Comte
Clementina Reply
what are agents of socialization
Antonio Reply
sociology of education
Nuhu Reply
definition of sociology of education
Nuhu
what is culture
Abdulrahim Reply
shared beliefs, values, and practices
AI-Robot
What are the two type of scientific method
ogunniran Reply
I'm willing to join you
Aceng Reply
what are the scientific method of sociology
Man
what is socialization
ogunniran Reply
the process wherein people come to understand societal norms and expectations, to accept society's beliefs, and to be aware of societal values
AI-Robot
scientific method in doing research
ogunniran
defimition of sickness in afica
Anita
Cosmology
ogunniran
Hmmm
ogunniran
list and explain the terms that found in society
REMMY Reply
list and explain the terms that found in society
Mukhtar
what are the agents of socialization
Antonio
Family Peer group Institution
Abdulwajud
I mean the definition
Antonio
ways of perceived deviance indifferent society
Naomi Reply
reasons of joining groups
SAM
to bring development to the nation at large
Hyellafiya
entails of consultative and consensus building from others
Gadama
World first Sociologist?
Abu
What is evolutionary model
Muhammad Reply
Evolution models refer to mathematical and computational representations of the processes involved in biological evolution. These models aim to simulate and understand how species change over time through mechanisms such as natural selection, genetic drift, and mutation. Evolutionary models can be u
faruk
what are the modern trends in religious behaviours
Selekeye Reply
what are social norms
Daniel Reply
shared standards of acceptable behavior by the group or appropriate behavior in a particular institution or those behaviors that are acceptable in a society
Lucius
that is how i understood it
Lucius
examples of societal norms
Diamond
Discuss the characteristics of the research located within positivist and the interpretivist paradigm
Tariro Reply
what is Industrialisation
Selekeye Reply
industrialization
Angelo
Got questions? Join the online conversation and get instant answers!
Jobilize.com Reply
Practice Key Terms 5

Get Jobilize Job Search Mobile App in your pocket Now!

Get it on Google Play Download on the App Store Now


Source:  OpenStax, Algebra and trigonometry. OpenStax CNX. Nov 14, 2016 Download for free at https://legacy.cnx.org/content/col11758/1.6
Google Play and the Google Play logo are trademarks of Google Inc.

Notification Switch

Would you like to follow the 'Algebra and trigonometry' conversation and receive update notifications?

Ask