<< Chapter < Page Chapter >> Page >

A regression was run to determine whether there is a relationship between the diameter of a tree ( x , in inches) and the tree’s age ( y , in years). The results of the regression are given below. Use this to predict the age of a tree with diameter 10 inches.

y = a x + b a = 6.301 b = −1.044   r = −0.970

61.966 years

Got questions? Get instant answers now!

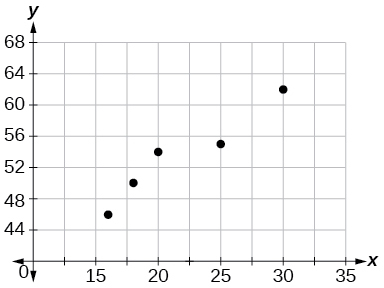
For the following exercises, draw a scatter plot for the data provided. Does the data appear to be linearly related?

0 2 4 6 8 10
–22 –19 –15 –11 –6 –2
Got questions? Get instant answers now!
1 2 3 4 5 6
46 50 59 75 100 136
Scatter plot with a collection of points appearing at (1,46); (2,50); (3,59); (4,75); (5, 100); and (6,136); they do not appear linear

No.

Got questions? Get instant answers now!
100 250 300 450 600 750
12 12.6 13.1 14 14.5 15.2
Got questions? Get instant answers now!
1 3 5 7 9 11
1 9 28 65 125 216
Scatterplot with a collection of points at (1,1); (3,9); (5,28); (7,65); (9,125); and (11,216); they do not appear linear

No.

Got questions? Get instant answers now!

For the following data, draw a scatter plot. If we wanted to know when the population would reach 15,000, would the answer involve interpolation or extrapolation? Eyeball the line, and estimate the answer.

Year Population
1990 11,500
1995 12,100
2000 12,700
2005 13,000
2010 13,750
Got questions? Get instant answers now!

For the following data, draw a scatter plot. If we wanted to know when the temperature would reach 28°F, would the answer involve interpolation or extrapolation? Eyeball the line and estimate the answer.

Temperature,°F 16 18 20 25 30
Time, seconds 46 50 54 55 62
Scatterplot with a collection of points at (16,46); (18,50); (20,54); (25,55); and (30,62); they appear nonlinear

Interpolation. About 60 ° F .

Got questions? Get instant answers now!

Graphical

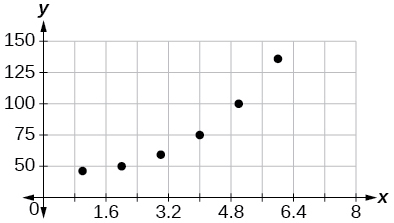
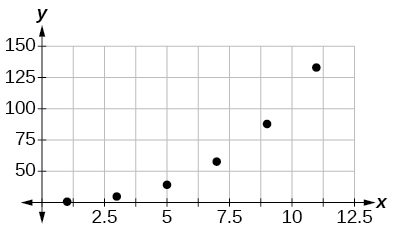
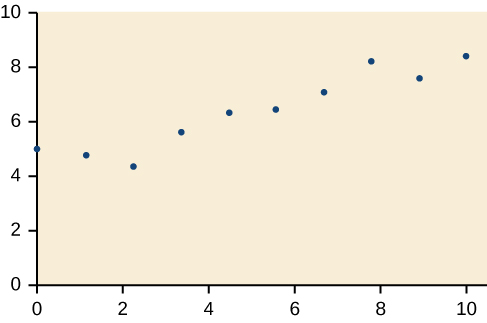
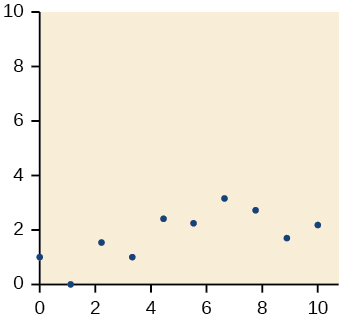
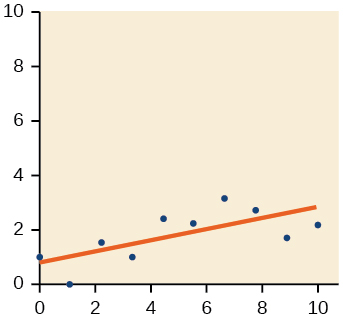
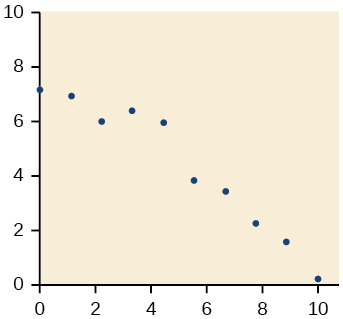
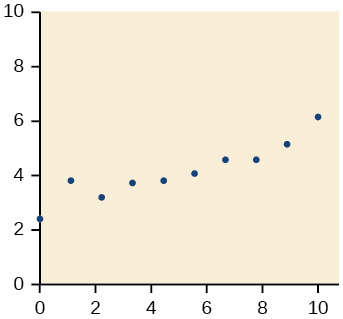
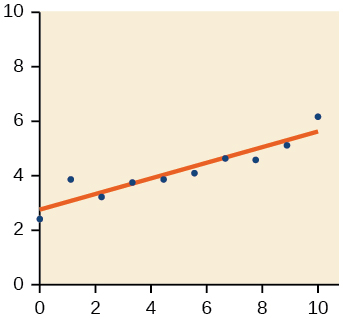
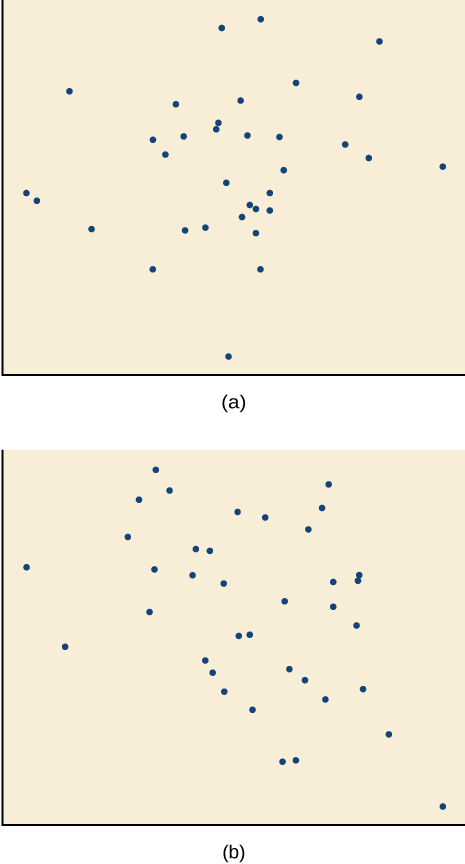
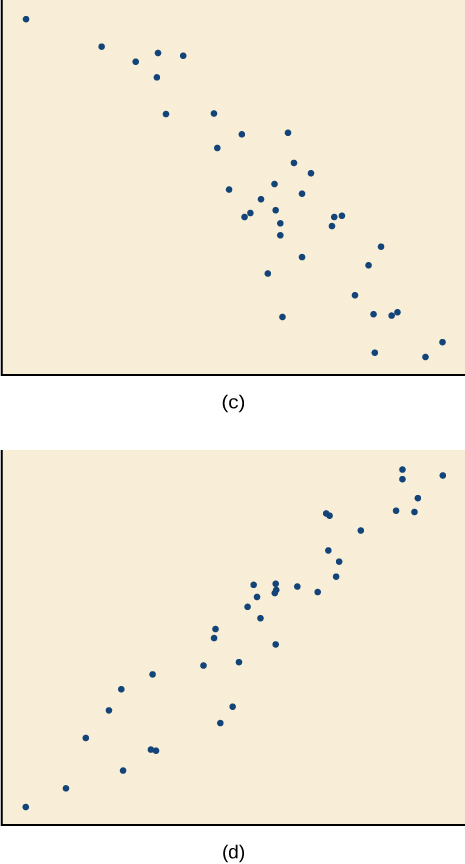
For the following exercises, match each scatterplot with one of the four specified correlations in [link] and [link] .

Side-by-side scatter plots.  The first is a scattered correlation in the positive direction.  The second is a scattered correlation in the negative direction
Side-by-side scatter plots.  The first has a strong negative correlation with all the points spaced out evenly near the top and center, but more spread out near the bottom.  The second has a strong positive correlation, with the points more spread out near the bottom and closer together near the center and top.

r = −0. 89

This value of r indicates a strong negative correlation or slope, so C

Got questions? Get instant answers now!

r = −0.39

This value of r indicates a weak negative correlation, so B

Got questions? Get instant answers now!

For the following exercises, draw a best-fit line for the plotted data.

Numeric

The U.S. Census tracks the percentage of persons 25 years or older who are college graduates. That data for several years is given in [link] . Based on data from http://www.census.gov/hhes/socdemo/education/data/cps/historical/index.html. Accessed 5/1/2014. Determine whether the trend appears linear. If so, and assuming the trend continues, in what year will the percentage exceed 35%?

Year Percent Graduates
1990 21.3
1992 21.4
1994 22.2
1996 23.6
1998 24.4
2000 25.6
2002 26.7
2004 27.7
2006 28
2008 29.4
Got questions? Get instant answers now!

The U.S. import of wine (in hectoliters) for several years is given in [link] . Determine whether the trend appears linear. If so, and assuming the trend continues, in what year will imports exceed 12,000 hectoliters?

Year Imports
1992 2665
1994 2688
1996 3565
1998 4129
2000 4584
2002 5655
2004 6549
2006 7950
2008 8487
2009 9462

Yes, trend appears linear because r = 0. 985 and will exceed 12,000 near midyear, 2016, 24.6 years since 1992.

Got questions? Get instant answers now!

[link] shows the year and the number of people unemployed in a particular city for several years. Determine whether the trend appears linear. If so, and assuming the trend continues, in what year will the number of unemployed reach 5?

Year Number Unemployed
1990 750
1992 670
1994 650
1996 605
1998 550
2000 510
2002 460
2004 420
2006 380
2008 320
Got questions? Get instant answers now!

Technology

For the following exercises, use each set of data to calculate the regression line using a calculator or other technology tool, and determine the correlation coefficient to 3 decimal places of accuracy.

x 8 15 26 31 56
y 23 41 53 72 103

y = 1 . 64 0 x + 13 . 8 00 , r = 0. 987

Got questions? Get instant answers now!
x 5 7 10 12 15
y 4 12 17 22 24
Got questions? Get instant answers now!
x y x y
3 21.9 10 18.54
4 22.22 11 15.76
5 22.74 12 13.68
6 22.26 13 14.1
7 20.78 14 14.02
8 17.6 15 11.94
9 16.52 16 12.76

y = 0.962 x + 26.86 ,       r = 0.965

Got questions? Get instant answers now!

Questions & Answers

how do you get the 2/50
Abba Reply
number of sport play by 50 student construct discrete data
Aminu Reply
width of the frangebany leaves on how to write a introduction
Theresa Reply
Solve the mean of variance
Veronica Reply
Step 1: Find the mean. To find the mean, add up all the scores, then divide them by the number of scores. ... Step 2: Find each score's deviation from the mean. ... Step 3: Square each deviation from the mean. ... Step 4: Find the sum of squares. ... Step 5: Divide the sum of squares by n – 1 or N.
kenneth
what is error
Yakuba Reply
Is mistake done to something
Vutshila
Hy
anas
hy
What is the life teble
anas
hy
Jibrin
statistics is the analyzing of data
Tajudeen Reply
what is statics?
Zelalem Reply
how do you calculate mean
Gloria Reply
diveving the sum if all values
Shaynaynay
let A1,A2 and A3 events be independent,show that (A1)^c, (A2)^c and (A3)^c are independent?
Fisaye Reply
what is statistics
Akhisani Reply
data collected all over the world
Shaynaynay
construct a less than and more than table
Imad Reply
The sample of 16 students is taken. The average age in the sample was 22 years with astandard deviation of 6 years. Construct a 95% confidence interval for the age of the population.
Aschalew Reply
Bhartdarshan' is an internet-based travel agency wherein customer can see videos of the cities they plant to visit. The number of hits daily is a normally distributed random variable with a mean of 10,000 and a standard deviation of 2,400 a. what is the probability of getting more than 12,000 hits? b. what is the probability of getting fewer than 9,000 hits?
Akshay Reply
Bhartdarshan'is an internet-based travel agency wherein customer can see videos of the cities they plan to visit. The number of hits daily is a normally distributed random variable with a mean of 10,000 and a standard deviation of 2,400. a. What is the probability of getting more than 12,000 hits
Akshay
1
Bright
Sorry i want to learn more about this question
Bright
Someone help
Bright
a= 0.20233 b=0.3384
Sufiyan
a
Shaynaynay
How do I interpret level of significance?
Mohd Reply
It depends on your business problem or in Machine Learning you could use ROC- AUC cruve to decide the threshold value
Shivam
how skewness and kurtosis are used in statistics
Owen Reply
yes what is it
Taneeya
Got questions? Join the online conversation and get instant answers!
Jobilize.com Reply
Practice Key Terms 5

Get Jobilize Job Search Mobile App in your pocket Now!

Get it on Google Play Download on the App Store Now


Source:  OpenStax, Algebra and trigonometry. OpenStax CNX. Nov 14, 2016 Download for free at https://legacy.cnx.org/content/col11758/1.6
Google Play and the Google Play logo are trademarks of Google Inc.

Notification Switch

Would you like to follow the 'Algebra and trigonometry' conversation and receive update notifications?

Ask