| << Chapter < Page | Chapter >> Page > |
With what kind of exponential model would half-life be associated? What role does half-life play in these models?
Half-life is a measure of decay and is thus associated with exponential decay models. The half-life of a substance or quantity is the amount of time it takes for half of the initial amount of that substance or quantity to decay.
What is carbon dating? Why does it work? Give an example in which carbon dating would be useful.
With what kind of exponential model would doubling time be associated? What role does doubling time play in these models?
Doubling time is a measure of growth and is thus associated with exponential growth models. The doubling time of a substance or quantity is the amount of time it takes for the initial amount of that substance or quantity to double in size.
Define Newton’s Law of Cooling. Then name at least three real-world situations where Newton’s Law of Cooling would be applied.
What is an order of magnitude? Why are orders of magnitude useful? Give an example to explain.
An order of magnitude is the nearest power of ten by which a quantity exponentially grows. It is also an approximate position on a logarithmic scale; Sample response: Orders of magnitude are useful when making comparisons between numbers that differ by a great amount. For example, the mass of Saturn is 95 times greater than the mass of Earth. This is the same as saying that the mass of Saturn is about times, or 2 orders of magnitude greater, than the mass of Earth.
The temperature of an object in degrees Fahrenheit after t minutes is represented by the equation To the nearest degree, what is the temperature of the object after one and a half hours?
For the following exercises, use the logistic growth model
Find and interpret Round to the nearest tenth.
The amount initially present is about 16.7 units.
Find and interpret Round to the nearest tenth.
Graph the model.
Determine whether the data from the table could best be represented as a function that is linear, exponential, or logarithmic. Then write a formula for a model that represents the data.
| –2 | 0.694 |
| –1 | 0.833 |
| 0 | 1 |
| 1 | 1.2 |
| 2 | 1.44 |
| 3 | 1.728 |
| 4 | 2.074 |
| 5 | 2.488 |
exponential;
Rewrite as an exponential equation with base to five significant digits.
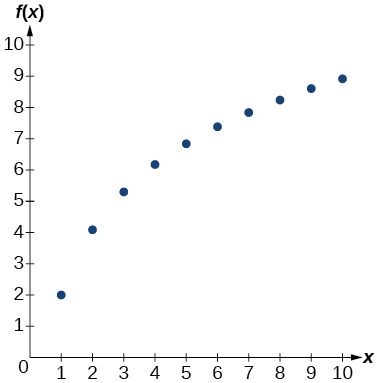
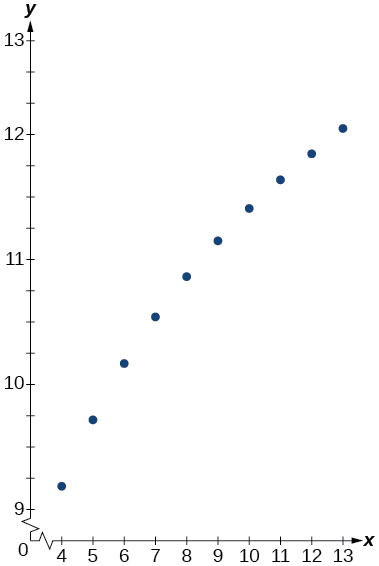
For the following exercises, enter the data from each table into a graphing calculator and graph the resulting scatter plots. Determine whether the data from the table could represent a function that is linear, exponential, or logarithmic.
| 1 | 2 |
| 2 | 4.079 |
| 3 | 5.296 |
| 4 | 6.159 |
| 5 | 6.828 |
| 6 | 7.375 |
| 7 | 7.838 |
| 8 | 8.238 |
| 9 | 8.592 |
| 10 | 8.908 |
logarithmic

| 1 | 2.4 |
| 2 | 2.88 |
| 3 | 3.456 |
| 4 | 4.147 |
| 5 | 4.977 |
| 6 | 5.972 |
| 7 | 7.166 |
| 8 | 8.6 |
| 9 | 10.32 |
| 10 | 12.383 |
| 4 | 9.429 |
| 5 | 9.972 |
| 6 | 10.415 |
| 7 | 10.79 |
| 8 | 11.115 |
| 9 | 11.401 |
| 10 | 11.657 |
| 11 | 11.889 |
| 12 | 12.101 |
| 13 | 12.295 |
logarithmic

| 1.25 | 5.75 |
| 2.25 | 8.75 |
| 3.56 | 12.68 |
| 4.2 | 14.6 |
| 5.65 | 18.95 |
| 6.75 | 22.25 |
| 7.25 | 23.75 |
| 8.6 | 27.8 |
| 9.25 | 29.75 |
| 10.5 | 33.5 |
For the following exercises, use a graphing calculator and this scenario: the population of a fish farm in years is modeled by the equation

Notification Switch
Would you like to follow the 'Algebra and trigonometry' conversation and receive update notifications?