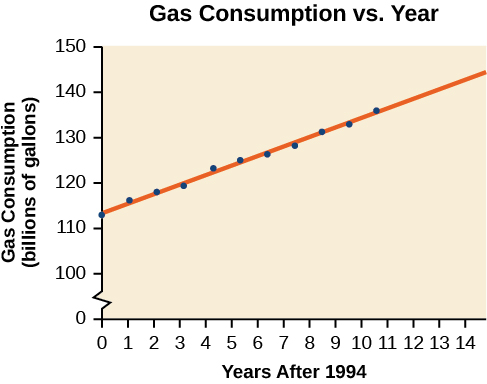
Gasoline consumption in the United States has been steadily increasing. Consumption data from 1994 to 2004 is shown in
[link] .
http://www.bts.gov/publications/national_transportation_statistics/2005/html/table_04_10.html Determine whether the trend is linear, and if so, find a model for the data. Use the model to predict the consumption in 2008.
Year
'94
'95
'96
'97
'98
'99
'00
'01
'02
'03
'04
Consumption (billions of gallons)
113
116
118
119
123
125
126
128
131
133
136
The scatter plot of the data, including the least squares regression line, is shown in
[link] .
We can introduce new input variable,
representing years since 1994.
The least squares regression equation is:
Using technology, the correlation coefficient was calculated to be 0.9965, suggesting a very strong increasing linear trend.
Using this to predict consumption in 2008
The model predicts 144.244 billion gallons of gasoline consumption in 2008.
Scatter plots show the relationship between two sets of data. See
[link] .
Scatter plots may represent linear or non-linear models.
The line of best fit may be estimated or calculated, using a calculator or statistical software. See
[link] .
Interpolation can be used to predict values inside the domain and range of the data, whereas extrapolation can be used to predict values outside the domain and range of the data. See
[link] .
The correlation coefficient,
indicates the degree of linear relationship between data. See
[link] .
A regression line best fits the data. See
[link] .
The least squares regression line is found by minimizing the squares of the distances of points from a line passing through the data and may be used to make predictions regarding either of the variables. See
[link] .
Section exercises
Verbal
Describe what it means if there is a model breakdown when using a linear model.
When our model no longer applies, after some value in the domain, the model itself doesn’t hold.
A regression was run to determine whether there is a relationship between hours of TV watched per day
and number of sit-ups a person can do
The results of the regression are given below. Use this to predict the number of sit-ups a person who watches 11 hours of TV can do.
is it possible to leave every good at the same level
Joseph
I don't think so. because check it, if the demand for chicken increases, people will no longer consume fish like they used to causing a fall in the demand for fish
Anuolu
is not really possible to let the value of a goods to be same at the same time.....
Salome
Suppose the inflation rate is 6%, does it mean that all the goods you purchase will cost
6% more than previous year? Provide with reasoning.
Not necessarily. To measure the inflation rate economists normally use an averaged price index of a basket of certain goods. So if you purchase goods included in the basket, you will notice that you pay 6% more, otherwise not necessarily.
Good day
How do I calculate this question: C= 100+5yd G= 2000 T= 2000 I(planned)=200.
Suppose the actual output is 3000. What is the level of planned expenditures at this level of output?
I am Camara from Guinea west Africa... happy to meet you guys here
Sekou
ma management ho
Amisha
ahile becheclor ho
Amisha
hjr ktm bta ho
ani k kaam grnu hunxa tw
Amisha
belatari
Amisha
1st year ho
Amisha
nd u
Amisha
ahh
Amisha
kaha biratnagar
Amisha
ys
Amisha
kina k vo
Amisha
money as unit of account means what?
Kalombe
A unit of account is something that can be used to value goods and services and make calculations
Jim
all of you please speak in English I can't understand you're language
Muhammad
I want to know how can we define macroeconomics in one line
Muhammad
it must be .9 or 0.9
no Mpc is greater than 1
Y=100+.9Y+50
Y-.9Y=150
0.1Y/0.1=150/0.1
Y=1500
Kalombe
Mercy is it clear?😋
Kalombe
hi can someone help me on this question
If a negative shocks shifts the IS curve to the left, what type of policy do you suggest so as to stabilize the level of output?
discuss your answer using appropriate graph.