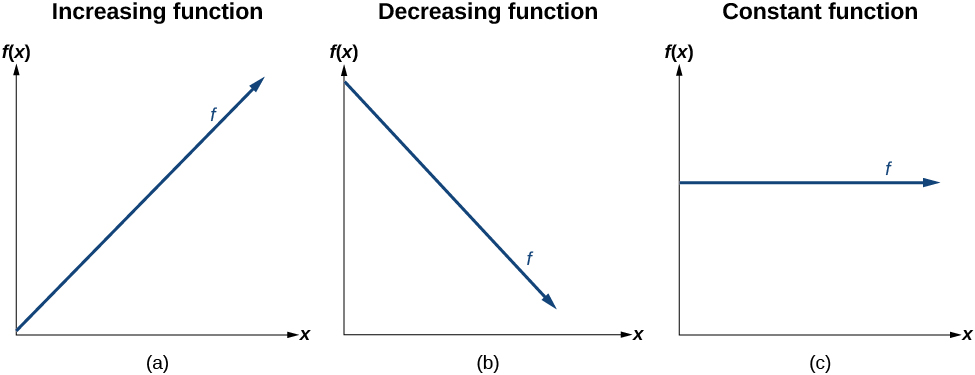
The slope determines if the function is an
increasing linear function , a
decreasing linear function , or a constant function.
is an increasing function if
is a decreasing function if
is a constant function if
Deciding whether a function is increasing, decreasing, or constant
Some recent studies suggest that a teenager sends an average of 60 texts per day
http://www.cbsnews.com/8301-501465_162-57400228-501465/teens-are-sending-60-texts-a-day-study-says/ . For each of the following scenarios, find the linear function that describes the relationship between the input value and the output value. Then, determine whether the graph of the function is increasing, decreasing, or constant.
The total number of texts a teen sends is considered a function of time in days. The input is the number of days, and output is the total number of texts sent.
A teen has a limit of 500 texts per month in his or her data plan. The input is the number of days, and output is the total number of texts remaining for the month.
A teen has an unlimited number of texts in his or her data plan for a cost of $50 per month. The input is the number of days, and output is the total cost of texting each month.
Analyze each function.
The function can be represented as
where
is the number of days. The slope, 60, is positive so the function is increasing. This makes sense because the total number of texts increases with each day.
The function can be represented as
where
is the number of days. In this case, the slope is negative so the function is decreasing. This makes sense because the number of texts remaining decreases each day and this function represents the number of texts remaining in the data plan after
days.
The cost function can be represented as
because the number of days does not affect the total cost. The slope is 0 so the function is constant.
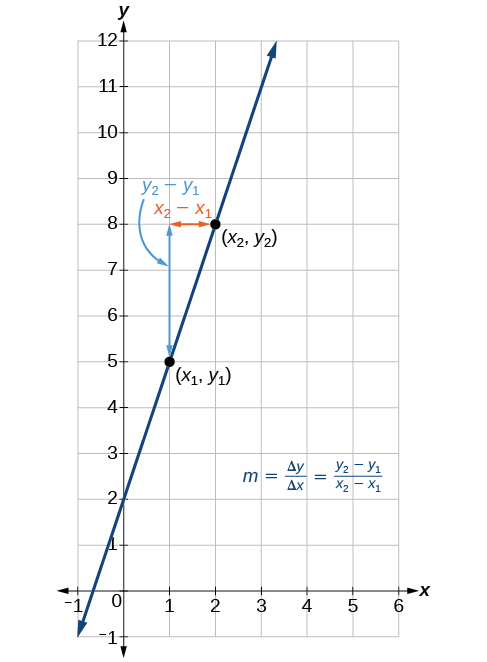
In the examples we have seen so far, the slope was provided to us. However, we often need to calculate the slope given input and output values. Recall that given two values for the input,
and
and two corresponding values for the output,
and
—which can be represented by a set of points,
and
—we can calculate the slope
Note that in function notation we can obtain two corresponding values for the output
and
for the function
and
so we could equivalently write
[link] indicates how the slope of the line between the points,
and
is calculated. Recall that the slope measures steepness, or slant. The greater the absolute value of the slope, the steeper the slant is.
The slope of a function is calculated by the change in
divided by the change in
It does not matter which coordinate is used as the
and which is the
as long as each calculation is started with the elements from the same coordinate pair.
is it possible to leave every good at the same level
Joseph
I don't think so. because check it, if the demand for chicken increases, people will no longer consume fish like they used to causing a fall in the demand for fish
Anuolu
is not really possible to let the value of a goods to be same at the same time.....
Salome
Suppose the inflation rate is 6%, does it mean that all the goods you purchase will cost
6% more than previous year? Provide with reasoning.
Not necessarily. To measure the inflation rate economists normally use an averaged price index of a basket of certain goods. So if you purchase goods included in the basket, you will notice that you pay 6% more, otherwise not necessarily.
Good day
How do I calculate this question: C= 100+5yd G= 2000 T= 2000 I(planned)=200.
Suppose the actual output is 3000. What is the level of planned expenditures at this level of output?
I am Camara from Guinea west Africa... happy to meet you guys here
Sekou
ma management ho
Amisha
ahile becheclor ho
Amisha
hjr ktm bta ho
ani k kaam grnu hunxa tw
Amisha
belatari
Amisha
1st year ho
Amisha
nd u
Amisha
ahh
Amisha
kaha biratnagar
Amisha
ys
Amisha
kina k vo
Amisha
money as unit of account means what?
Kalombe
A unit of account is something that can be used to value goods and services and make calculations
Jim
all of you please speak in English I can't understand you're language
Muhammad
I want to know how can we define macroeconomics in one line
Muhammad
it must be .9 or 0.9
no Mpc is greater than 1
Y=100+.9Y+50
Y-.9Y=150
0.1Y/0.1=150/0.1
Y=1500
Kalombe
Mercy is it clear?😋
Kalombe
hi can someone help me on this question
If a negative shocks shifts the IS curve to the left, what type of policy do you suggest so as to stabilize the level of output?
discuss your answer using appropriate graph.