Now that we have learned to graph nonlinear inequalities, we can learn how to graph systems of nonlinear inequalities. A
system of nonlinear inequalities is a system of two or more inequalities in two or more variables containing at least one inequality that is not linear. Graphing a system of nonlinear inequalities is similar to graphing a system of linear inequalities. The difference is that our graph may result in more shaded regions that represent a solution than we find in a system of linear inequalities. The solution to a nonlinear system of inequalities is the region of the graph where the shaded regions of the graph of each inequality overlap, or where the regions intersect, called the
feasible region .
Given a system of nonlinear inequalities, sketch a graph.
Find the intersection points by solving the corresponding system of nonlinear equations.
Graph the nonlinear equations.
Find the shaded regions of each inequality.
Identify the feasible region as the intersection of the shaded regions of each inequality or the set of points common to each inequality.
Graphing a system of inequalities
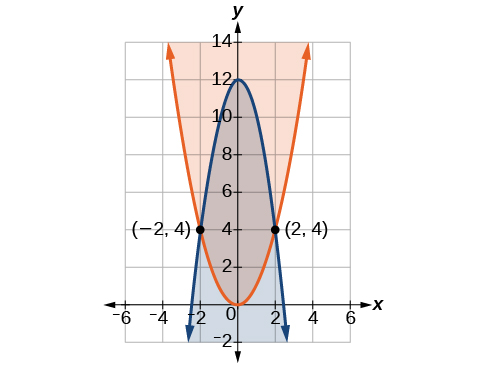
Graph the given system of inequalities.
These two equations are clearly parabolas. We can find the points of intersection by the elimination process: Add both equations and the variable
will be eliminated. Then we solve for
Substitute the
x -values into one of the equations and solve for
The two points of intersection are
and
Notice that the equations can be rewritten as follows.
Graph each inequality. See
[link] . The feasible region is the region between the two equations bounded by
on the top and
on the bottom.
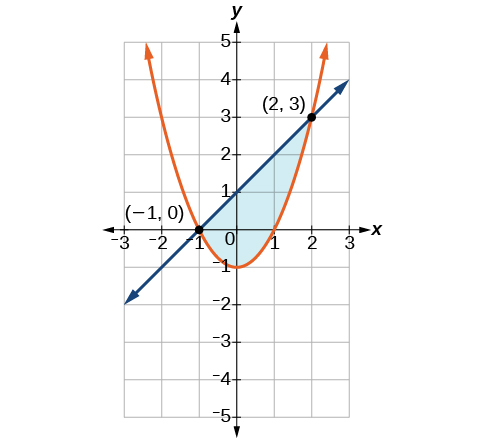
There are three possible types of solutions to a system of equations representing a line and a parabola: (1) no solution, the line does not intersect the parabola; (2) one solution, the line is tangent to the parabola; and (3) two solutions, the line intersects the parabola in two points. See
[link] .
There are three possible types of solutions to a system of equations representing a circle and a line: (1) no solution, the line does not intersect the circle; (2) one solution, the line is tangent to the parabola; (3) two solutions, the line intersects the circle in two points. See
[link] .
There are five possible types of solutions to the system of nonlinear equations representing an ellipse and a circle:
(1) no solution, the circle and the ellipse do not intersect; (2) one solution, the circle and the ellipse are tangent to each other; (3) two solutions, the circle and the ellipse intersect in two points; (4) three solutions, the circle and ellipse intersect in three places; (5) four solutions, the circle and the ellipse intersect in four points. See
[link] .
An inequality is graphed in much the same way as an equation, except for>or<, we draw a dashed line and shade the region containing the solution set. See
[link] .
Inequalities are solved the same way as equalities, but solutions to systems of inequalities must satisfy both inequalities. See
[link] .
Questions & Answers
differentiate between demand and supply
giving examples
In economics, a perfect market refers to a theoretical construct where all participants have perfect information, goods are homogenous, there are no barriers to entry or exit, and prices are determined solely by supply and demand. It's an idealized model used for analysis,
When MP₁ becomes negative, TP start to decline.
Extuples Suppose that the short-run production function of certain cut-flower firm is given by: Q=4KL-0.6K2 - 0.112 •
Where is quantity of cut flower produced, I is labour input and K is fixed capital input (K-5). Determine the average product of lab
Kelo
Extuples Suppose that the short-run production function of certain cut-flower firm is given by: Q=4KL-0.6K2 - 0.112 •
Where is quantity of cut flower produced, I is labour input and K is fixed capital input (K-5). Determine the average product of labour (APL) and marginal product of labour (MPL)
Quantity demanded refers to the specific amount of a good or service that consumers are willing and able to purchase at a give price and within a specific time period. Demand, on the other hand, is a broader concept that encompasses the entire relationship between price and quantity demanded
Ezea
ok
Shukri
how do you save a country economic situation when it's falling apart
Economic growth as an increase in the production and consumption of goods and services within an economy.but
Economic development as a broader concept that encompasses not only economic growth but also social & human well being.
Shukri
production function means
Jabir
What do you think is more important to focus on when considering inequality ?
sir...I just want to ask one question... Define the term contract curve? if you are free please help me to find this answer 🙏
Asui
it is a curve that we get after connecting the pareto optimal combinations of two consumers after their mutually beneficial trade offs
Awais
thank you so much 👍 sir
Asui
In economics, the contract curve refers to the set of points in an Edgeworth box diagram where both parties involved in a trade cannot be made better off without making one of them worse off. It represents the Pareto efficient allocations of goods between two individuals or entities, where neither p
Cornelius
In economics, the contract curve refers to the set of points in an Edgeworth box diagram where both parties involved in a trade cannot be made better off without making one of them worse off. It represents the Pareto efficient allocations of goods between two individuals or entities,
Cornelius
Suppose a consumer consuming two commodities X and Y has
The following utility function u=X0.4 Y0.6. If the price of the X and Y are 2 and 3 respectively and income Constraint is birr 50.
A,Calculate quantities of x and y which maximize utility.
B,Calculate value of Lagrange multiplier.
C,Calculate quantities of X and Y consumed with a given price.
D,alculate optimum level of output .
the market for lemon has 10 potential consumers, each having an individual demand curve p=101-10Qi, where p is price in dollar's per cup and Qi is the number of cups demanded per week by the i th consumer.Find the market demand curve using algebra. Draw an individual demand curve and the market dema
suppose the production function is given by ( L, K)=L¼K¾.assuming capital is fixed find APL and MPL. consider the following short run production function:Q=6L²-0.4L³ a) find the value of L that maximizes output b)find the value of L that maximizes marginal product