| << Chapter < Page | Chapter >> Page > |
Is the initial value always provided in a table of values like [link] ?
No. Sometimes the initial value is provided in a table of values, but sometimes it is not. If you see an input of 0, then the initial value would be the corresponding output. If the initial value is not provided because there is no value of input on the table equal to 0, find the slope, substitute one coordinate pair and the slope into and solve for
A new plant food was introduced to a young tree to test its effect on the height of the tree. [link] shows the height of the tree, in feet, months since the measurements began. Write a linear function, where is the number of months since the start of the experiment.
| x | 0 | 2 | 4 | 8 | 12 |
| H ( x ) | 12.5 | 13.5 | 14.5 | 16.5 | 18.5 |
Now that we’ve seen and interpreted graphs of linear functions, let’s take a look at how to create the graphs. There are three basic methods of graphing linear functions. The first is by plotting points and then drawing a line through the points. The second is by using the y- intercept and slope. And the third method is by using transformations of the identity function
To find points of a function, we can choose input values, evaluate the function at these input values, and calculate output values. The input values and corresponding output values form coordinate pairs. We then plot the coordinate pairs on a grid. In general, we should evaluate the function at a minimum of two inputs in order to find at least two points on the graph. For example, given the function, we might use the input values 1 and 2. Evaluating the function for an input value of 1 yields an output value of 2, which is represented by the point Evaluating the function for an input value of 2 yields an output value of 4, which is represented by the point Choosing three points is often advisable because if all three points do not fall on the same line, we know we made an error.
Given a linear function, graph by plotting points.
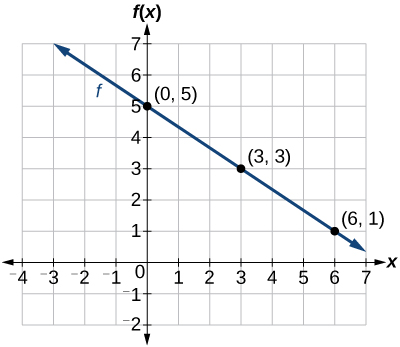
Graph by plotting points.
Begin by choosing input values. This function includes a fraction with a denominator of 3, so let’s choose multiples of 3 as input values. We will choose 0, 3, and 6.
Evaluate the function at each input value, and use the output value to identify coordinate pairs.
Plot the coordinate pairs and draw a line through the points. [link] represents the graph of the function

Another way to graph linear functions is by using specific characteristics of the function rather than plotting points. The first characteristic is its y- intercept, which is the point at which the input value is zero. To find the y- intercept, we can set in the equation.

Notification Switch
Would you like to follow the 'Algebra and trigonometry' conversation and receive update notifications?