| << Chapter < Page | Chapter >> Page > |
Given a graph of linear function, find the equation to describe the function.
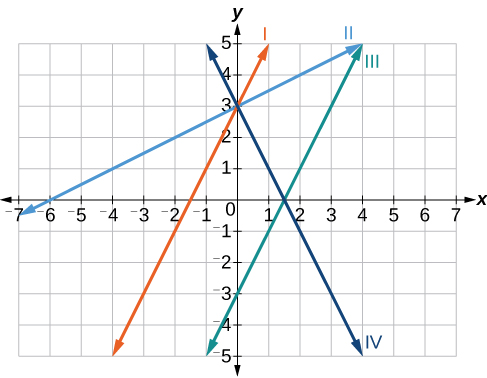
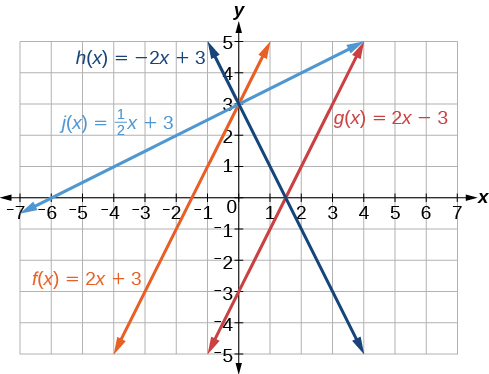
Match each equation of the linear functions with one of the lines in [link] .

Analyze the information for each function.
Now we can re-label the lines as in [link] .

So far we have been finding the y- intercepts of a function: the point at which the graph of the function crosses the y -axis. Recall that a function may also have an x -intercept , which is the x -coordinate of the point where the graph of the function crosses the x -axis. In other words, it is the input value when the output value is zero.
To find the x -intercept, set a function equal to zero and solve for the value of For example, consider the function shown.
Set the function equal to 0 and solve for
The graph of the function crosses the x -axis at the point
Do all linear functions have x -intercepts?
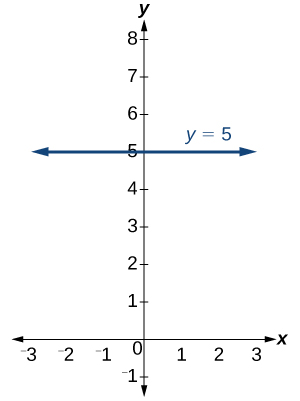
No. However, linear functions of the form where is a nonzero real number are the only examples of linear functions with no x-intercept. For example, is a horizontal line 5 units above the x-axis. This function has no x-intercepts, as shown in [link] .

The x -intercept of the function is value of when It can be solved by the equation
Find the x -intercept of
Set the function equal to zero to solve for
The graph crosses the x -axis at the point
There are two special cases of lines on a graph—horizontal and vertical lines. A horizontal line indicates a constant output, or y -value. In [link] , we see that the output has a value of 2 for every input value. The change in outputs between any two points, therefore, is 0. In the slope formula, the numerator is 0, so the slope is 0. If we use in the equation the equation simplifies to In other words, the value of the function is a constant. This graph represents the function

Notification Switch
Would you like to follow the 'Algebra and trigonometry' conversation and receive update notifications?