<< Chapter < Page Chapter >> Page >

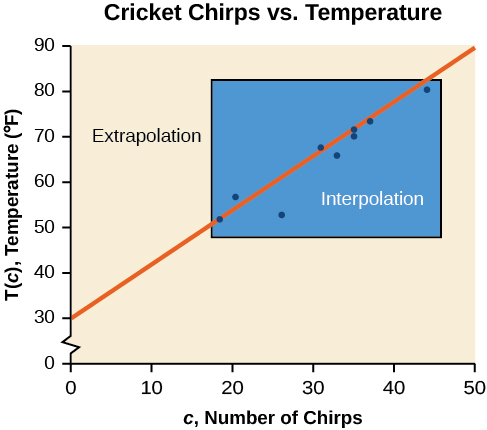
[link] compares the two processes for the cricket-chirp data addressed in [link] . We can see that interpolation would occur if we used our model to predict temperature when the values for chirps are between 18.5 and 44. Extrapolation would occur if we used our model to predict temperature when the values for chirps are less than 18.5 or greater than 44.

There is a difference between making predictions inside the domain and range of values for which we have data and outside that domain and range. Predicting a value outside of the domain and range has its limitations. When our model no longer applies after a certain point, it is sometimes called model breakdown    . For example, predicting a cost function for a period of two years may involve examining the data where the input is the time in years and the output is the cost. But if we try to extrapolate a cost when x = 50 , that is in 50 years, the model would not apply because we could not account for factors fifty years in the future.

Scatter plot, showing the line of best fit. It is titled 'Cricket Chirps Vs Air Temperature'. The x-axis is 'c, Number of Chirps', and the y-axis is 'T(c), Temperature (F)'.  The area around the scattered points is enclosed in a box labeled: Interpolation.  The area outside of this box is labeled: Extrapolation.
Interpolation occurs within the domain and range of the provided data whereas extrapolation occurs outside.

Interpolation and extrapolation

Different methods of making predictions are used to analyze data.

The method of interpolation    involves predicting a value inside the domain and/or range of the data.
The method of extrapolation    involves predicting a value outside the domain and/or range of the data.
Model breakdown occurs at the point when the model no longer applies.

Understanding interpolation and extrapolation

Use the cricket data from [link] to answer the following questions:

  1. Would predicting the temperature when crickets are chirping 30 times in 15 seconds be interpolation or extrapolation? Make the prediction, and discuss whether it is reasonable.
  2. Would predicting the number of chirps crickets will make at 40 degrees be interpolation or extrapolation? Make the prediction, and discuss whether it is reasonable.
  1. The number of chirps in the data provided varied from 18.5 to 44. A prediction at 30 chirps per 15 seconds is inside the domain of our data, so would be interpolation. Using our model:
    T (30) = 30 + 1.2(30) = 66 degrees

    Based on the data we have, this value seems reasonable.

  2. The temperature values varied from 52 to 80.5. Predicting the number of chirps at 40 degrees is extrapolation because 40 is outside the range of our data. Using our model:
    40 = 30 + 1.2 c 10 = 1.2 c    c 8.33

We can compare the regions of interpolation and extrapolation using [link] .

Scatter plot, showing the line of best fit and where interpolation and extrapolation occurs. It is titled 'Cricket Chirps vs. Air Temperature'. The x-axis is 'c, Number of Chirps', and the y-axis is 'T(c), Temperature (F)'.  An additional point is plotted inside of the box to represent an interpolated point.  There is another additional point plotted outside of the box to represent an extrapolated point.
Got questions? Get instant answers now!

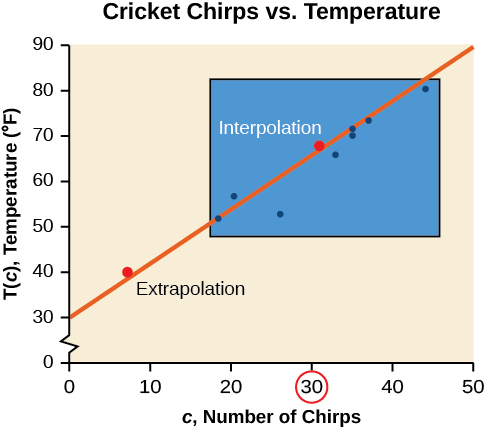
According to the data from [link] , what temperature can we predict it is if we counted 20 chirps in 15 seconds?

54 ° F

Got questions? Get instant answers now!

Finding the line of best fit using a graphing utility

While eyeballing a line works reasonably well, there are statistical techniques for fitting a line to data that minimize the differences between the line and data values Technically, the method minimizes the sum of the squared differences in the vertical direction between the line and the data values. . One such technique is called least squares regression    and can be computed by many graphing calculators, spreadsheet software, statistical software, and many web-based calculators For example, http://www.shodor.org/unchem/math/lls/leastsq.html . Least squares regression is one means to determine the line that best fits the data, and here we will refer to this method as linear regression.

Questions & Answers

it is the relatively stable flow of income
Chidubem Reply
what is circular flow of income
Divine Reply
branches of macroeconomics
SHEDRACK Reply
what is Flexible exchang rate?
poudel Reply
is gdp a reliable measurement of wealth
Atega Reply
introduction to econometrics
Husseini Reply
Hi
mostafa
hi
LEMLEM
hello
Sammol
hi
Mahesh
bi
Ruqayat
hi
Ruqayat
Hi fellas
Nyawa
hey
Sammol
hi
God
hello
Jahara
Good morning
Jorge
hi
abubakar
hi
Nmesoma
hi
Mahesh
Hi
Tom
Why is unemployment rate never zero at full employment?
Priyanka Reply
bcoz of existence of frictional unemployment in our economy.
Umashankar
what is flexible exchang rate?
poudel
due to existence of the pple with disabilities
Abdulraufu
the demand of a good rises, causing the demand for another good to fall
Rushawn Reply
is it possible to leave every good at the same level
Joseph
I don't think so. because check it, if the demand for chicken increases, people will no longer consume fish like they used to causing a fall in the demand for fish
Anuolu
is not really possible to let the value of a goods to be same at the same time.....
Salome
Suppose the inflation rate is 6%, does it mean that all the goods you purchase will cost 6% more than previous year? Provide with reasoning.
Geetha Reply
Not necessarily. To measure the inflation rate economists normally use an averaged price index of a basket of certain goods. So if you purchase goods included in the basket, you will notice that you pay 6% more, otherwise not necessarily.
Waeth
discus major problems of macroeconomics
Alii Reply
what is the problem of macroeconomics
Yoal
Economic growth Stable prices and low unemployment
Ephraim
explain inflationcause and itis degre
Miresa Reply
what is inflation
Getu
increase in general price levels
WEETO
Good day How do I calculate this question: C= 100+5yd G= 2000 T= 2000 I(planned)=200. Suppose the actual output is 3000. What is the level of planned expenditures at this level of output?
Chisomo Reply
how to calculate actual output?
Chisomo
how to calculate the equilibrium income
Beshir
Criteria for determining money supply
Thapase Reply
who we can define macroeconomics in one line
Muhammad
Aggregate demand
Mohammed
C=k100 +9y and i=k50.calculate the equilibrium level of output
Mercy Reply
Hi
Isiaka
Hi
Geli
hy
Man
👋
Bahunda
hy how are you?
Man
ys
Amisha
how are you guys
Sekou
f9 guys
Amisha
how are you guys
Sekou
ys am also fine
Amisha
fine and you guys
Geli
from Nepal
Amisha
nawalparasi district from belatari
Amisha
nd u
Amisha
I am Camara from Guinea west Africa... happy to meet you guys here
Sekou
ma management ho
Amisha
ahile becheclor ho
Amisha
hjr ktm bta ho ani k kaam grnu hunxa tw
Amisha
belatari
Amisha
1st year ho
Amisha
nd u
Amisha
ahh
Amisha
kaha biratnagar
Amisha
ys
Amisha
kina k vo
Amisha
money as unit of account means what?
Kalombe
A unit of account is something that can be used to value goods and services and make calculations
Jim
all of you please speak in English I can't understand you're language
Muhammad
I want to know how can we define macroeconomics in one line
Muhammad
it must be .9 or 0.9 no Mpc is greater than 1 Y=100+.9Y+50 Y-.9Y=150 0.1Y/0.1=150/0.1 Y=1500
Kalombe
Mercy is it clear?😋
Kalombe
hi can someone help me on this question If a negative shocks shifts the IS curve to the left, what type of policy do you suggest so as to stabilize the level of output? discuss your answer using appropriate graph.
Galge Reply
if interest rate is increased this will will reduce the level of income shifting the curve to the left ◀️
Kalombe
Got questions? Join the online conversation and get instant answers!
Jobilize.com Reply
Practice Key Terms 5

Get Jobilize Job Search Mobile App in your pocket Now!

Get it on Google Play Download on the App Store Now


Source:  OpenStax, Algebra and trigonometry. OpenStax CNX. Nov 14, 2016 Download for free at https://legacy.cnx.org/content/col11758/1.6
Google Play and the Google Play logo are trademarks of Google Inc.

Notification Switch

Would you like to follow the 'Algebra and trigonometry' conversation and receive update notifications?

Ask