| << Chapter < Page | Chapter >> Page > |
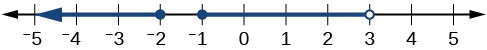
Describe the intervals of values shown in [link] using inequality notation, set-builder notation, and interval notation.
To describe the values, included in the intervals shown, we would say, “ is a real number greater than or equal to 1 and less than or equal to 3, or a real number greater than 5.”
| Inequality | |
| Set-builder notation | |
| Interval notation |
Remember that, when writing or reading interval notation, using a square bracket means the boundary is included in the set. Using a parenthesis means the boundary is not included in the set.
Another way to identify the domain and range of functions is by using graphs. Because the domain refers to the set of possible input values, the domain of a graph consists of all the input values shown on the x -axis. The range is the set of possible output values, which are shown on the y -axis. Keep in mind that if the graph continues beyond the portion of the graph we can see, the domain and range may be greater than the visible values. See [link] .
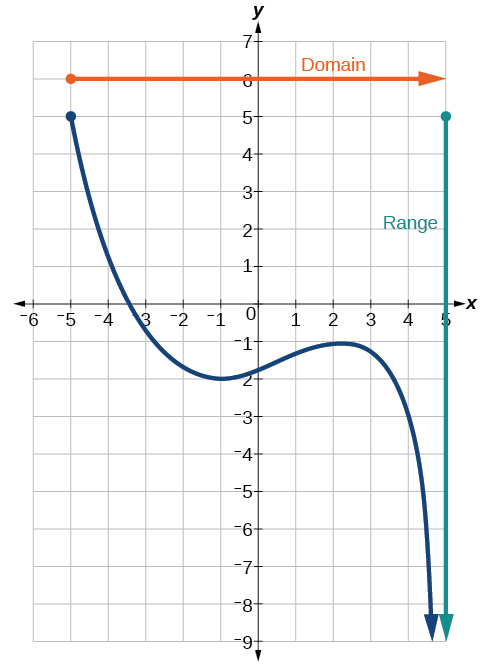
We can observe that the graph extends horizontally from to the right without bound, so the domain is The vertical extent of the graph is all range values and below, so the range is Note that the domain and range are always written from smaller to larger values, or from left to right for domain, and from the bottom of the graph to the top of the graph for range.
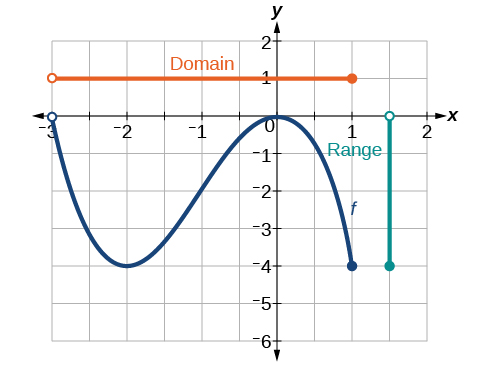
Find the domain and range of the function whose graph is shown in [link] .
![Graph of a function from (-3, 1].](/ocw/mirror/col11758/m51262/CNX_Precalc_Figure_01_02_007.jpg)
We can observe that the horizontal extent of the graph is –3 to 1, so the domain of is
The vertical extent of the graph is 0 to –4, so the range is See [link] .
Find the domain and range of the function whose graph is shown in [link] .
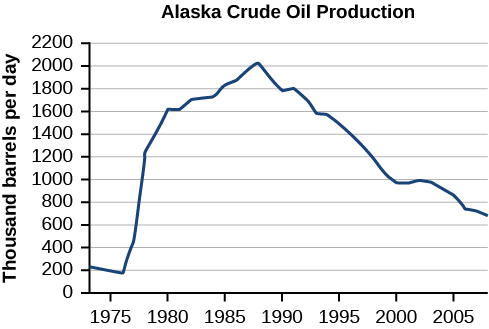
The input quantity along the horizontal axis is “years,” which we represent with the variable for time. The output quantity is “thousands of barrels of oil per day,” which we represent with the variable for barrels. The graph may continue to the left and right beyond what is viewed, but based on the portion of the graph that is visible, we can determine the domain as and the range as approximately
In interval notation, the domain is [1973, 2008], and the range is about [180, 2010]. For the domain and the range, we approximate the smallest and largest values since they do not fall exactly on the grid lines.
Given [link] , identify the domain and range using interval notation.
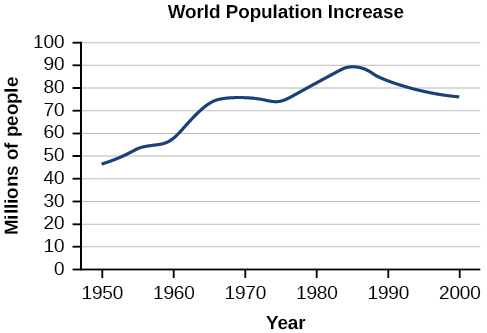
domain =[1950,2002] range = [47,000,000,89,000,000]
Notification Switch
Would you like to follow the 'Algebra and trigonometry' conversation and receive update notifications?

|
|
|
|
|

|
|

|
|

|
|

|
|

|
|

|
|

|
|

|
|

|
|

|