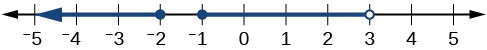
Describe the intervals of values shown in
[link] using inequality notation, set-builder notation, and interval notation.
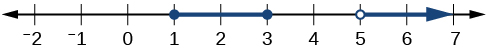
To describe the values,
included in the intervals shown, we would say, “
is a real number greater than or equal to 1 and less than or equal to 3, or a real number greater than 5.”
Inequality
Set-builder notation
Interval notation
Remember that, when writing or reading interval notation, using a square bracket means the boundary is included in the set. Using a parenthesis means the boundary is not included in the set.
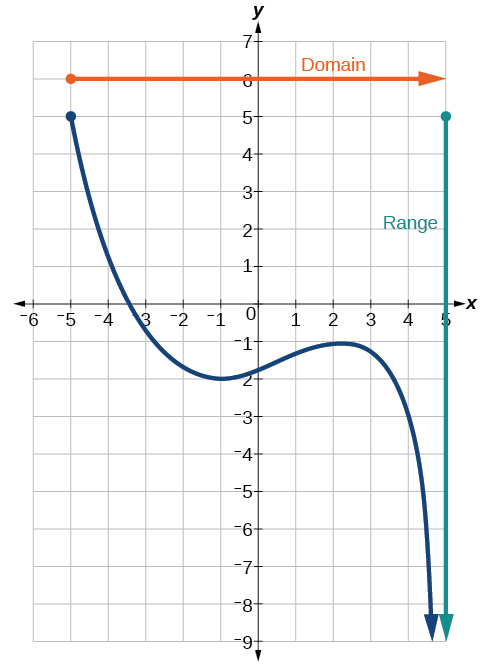
Another way to identify the domain and range of functions is by using graphs. Because the domain refers to the set of possible input values, the domain of a graph consists of all the input values shown on the
x -axis. The range is the set of possible output values, which are shown on the
y -axis. Keep in mind that if the graph continues beyond the portion of the graph we can see, the domain and range may be greater than the visible values. See
[link] .
We can observe that the graph extends horizontally from
to the right without bound, so the domain is
The vertical extent of the graph is all range values
and below, so the range is
Note that the domain and range are always written from smaller to larger values, or from left to right for domain, and from the bottom of the graph to the top of the graph for range.
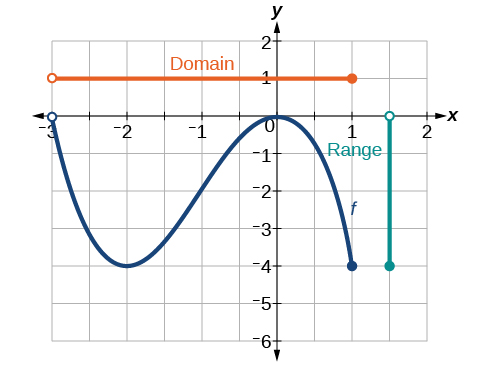
Finding domain and range from a graph
Find the domain and range of the function
whose graph is shown in
[link] .
We can observe that the horizontal extent of the graph is –3 to 1, so the domain of
is
The vertical extent of the graph is 0 to –4, so the range is
See
[link] .
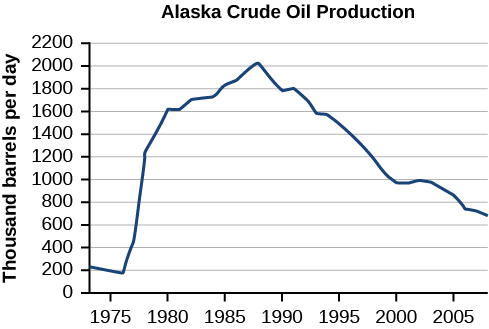
Finding domain and range from a graph of oil production
Find the domain and range of the function
whose graph is shown in
[link] .
(credit: modification of work by the U.S. Energy Information Administration)
http://www.eia.gov/dnav/pet/hist/LeafHandler.ashx?n=PET&s=MCRFPAK2&f=A.
The input quantity along the horizontal axis is “years,” which we represent with the variable
for time. The output quantity is “thousands of barrels of oil per day,” which we represent with the variable
for barrels. The graph may continue to the left and right beyond what is viewed, but based on the portion of the graph that is visible, we can determine the domain as
and the range as approximately
In interval notation, the domain is [1973, 2008], and the range is about [180, 2010]. For the domain and the range, we approximate the smallest and largest values since they do not fall exactly on the grid lines.
Bacteria doesn't produce energy they are dependent upon their substrate in case of lack of nutrients they are able to make spores which helps them to sustain in harsh environments
_Adnan
But not all bacteria make spores, l mean Eukaryotic cells have Mitochondria which acts as powerhouse for them, since bacteria don't have it, what is the substitution for it?
Assimilatory nitrate reduction is a process that occurs in some microorganisms, such as bacteria and archaea, in which nitrate (NO3-) is reduced to nitrite (NO2-), and then further reduced to ammonia (NH3).
Elkana
This process is called assimilatory nitrate reduction because the nitrogen that is produced is incorporated in the cells of microorganisms where it can be used in the synthesis of amino acids and other nitrogen products
There are nothing like emergency disease but there are some common medical emergency which can occur simultaneously like Bleeding,heart attack,Breathing difficulties,severe pain heart stock.Hope you will get my point .Have a nice day ❣️
_Adnan
define infection ,prevention and control
Innocent
I think infection prevention and control is the avoidance of all things we do that gives out break of infections and promotion of health practices that promote life


![Graph of a function from (-3, 1].](/ocw/mirror/col11758/m51262/CNX_Precalc_Figure_01_02_007.jpg)