<< Chapter < Page Chapter >> Page >

Given data of input and corresponding outputs from a linear function, find the best fit line using linear regression.

  1. Enter the input in List 1 (L1).
  2. Enter the output in List 2 (L2).
  3. On a graphing utility, select Linear Regression (LinReg).

Finding a least squares regression line

Find the least squares regression line using the cricket-chirp data in [link] .

  1. Enter the input (chirps) in List 1 (L1).
  2. Enter the output (temperature) in List 2 (L2). See [link] .
    L1 44 35 20.4 33 31 35 18.5 37 26
    L2 80.5 70.5 57 66 68 72 52 73.5 53
  3. On a graphing utility, select Linear Regression (LinReg). Using the cricket chirp data from earlier, with technology we obtain the equation:
T ( c ) = 30.281 + 1.143 c
Got questions? Get instant answers now!

Will there ever be a case where two different lines will serve as the best fit for the data?

No. There is only one best fit line.

Distinguishing between linear and nonlinear models

As we saw above with the cricket-chirp model, some data exhibit strong linear trends, but other data, like the final exam scores plotted by age, are clearly nonlinear. Most calculators and computer software can also provide us with the correlation coefficient    , which is a measure of how closely the line fits the data. Many graphing calculators require the user to turn a ”diagnostic on” selection to find the correlation coefficient, which mathematicians label as r The correlation coefficient provides an easy way to get an idea of how close to a line the data falls.

We should compute the correlation coefficient only for data that follows a linear pattern or to determine the degree to which a data set is linear. If the data exhibits a nonlinear pattern, the correlation coefficient for a linear regression is meaningless. To get a sense for the relationship between the value of r and the graph of the data, [link] shows some large data sets with their correlation coefficients. Remember, for all plots, the horizontal axis shows the input and the vertical axis shows the output.

Correlation coefficients values range from -1.0 - 1.0.  Collections of dots representing an example of each kind of correlation coefficient are plotted underneath them.  The closer to 1.0 the more the points are grouped tightly to form a line in the positive direction.  The closer to -1.0 the more the points are grouped tightly to form a line in the negative direction.  The closer to 0 the points are very scattered and do not form a line.  Several shapes are displayed at the bottom row, none of which are lines, but all of them have values of 0.
Plotted data and related correlation coefficients. (credit: “DenisBoigelot,” Wikimedia Commons)

Correlation coefficient

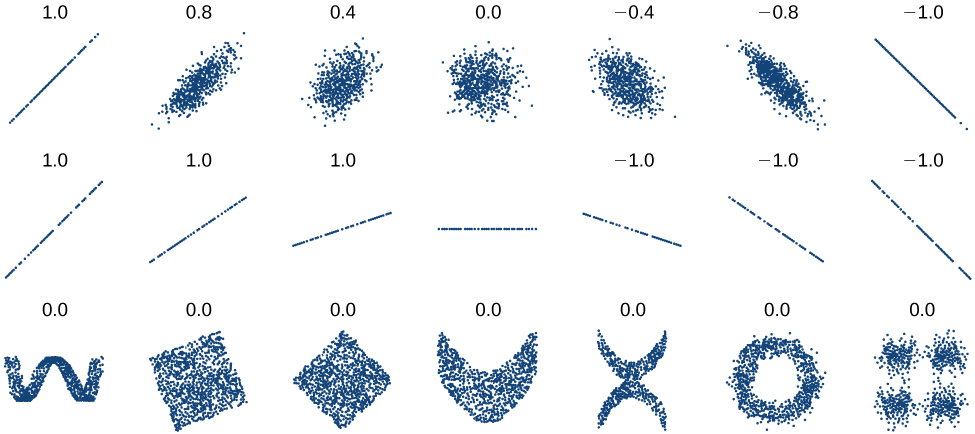
The correlation coefficient is a value, r , between –1 and 1.

  • r > 0 suggests a positive (increasing) relationship
  • r < 0 suggests a negative (decreasing) relationship
  • The closer the value is to 0, the more scattered the data.
  • The closer the value is to 1 or –1, the less scattered the data is.

Finding a correlation coefficient

Calculate the correlation coefficient for cricket-chirp data in [link] .

Because the data appear to follow a linear pattern, we can use technology to calculate r Enter the inputs and corresponding outputs and select the Linear Regression. The calculator will also provide you with the correlation coefficient, r = 0.9509. This value is very close to 1, which suggests a strong increasing linear relationship.

Note: For some calculators, the Diagnostics must be turned "on" in order to get the correlation coefficient when linear regression is performed: [2nd]>[0]>[alpha][x–1], then scroll to DIAGNOSTICSON.

Got questions? Get instant answers now!

Fitting a regression line to a set of data

Once we determine that a set of data is linear using the correlation coefficient, we can use the regression line to make predictions. As we learned above, a regression line is a line that is closest to the data in the scatter plot, which means that only one such line is a best fit for the data.

Questions & Answers

Ayele, K., 2003. Introductory Economics, 3rd ed., Addis Ababa.
Widad Reply
can you send the book attached ?
Ariel
?
Ariel
What is economics
Widad Reply
the study of how humans make choices under conditions of scarcity
AI-Robot
U(x,y) = (x×y)1/2 find mu of x for y
Desalegn Reply
U(x,y) = (x×y)1/2 find mu of x for y
Desalegn
what is ecnomics
Jan Reply
this is the study of how the society manages it's scarce resources
Belonwu
what is macroeconomic
John Reply
macroeconomic is the branch of economics which studies actions, scale, activities and behaviour of the aggregate economy as a whole.
husaini
etc
husaini
difference between firm and industry
husaini Reply
what's the difference between a firm and an industry
Abdul
firm is the unit which transform inputs to output where as industry contain combination of firms with similar production 😅😅
Abdulraufu
Suppose the demand function that a firm faces shifted from Qd  120 3P to Qd  90  3P and the supply function has shifted from QS  20  2P to QS 10  2P . a) Find the effect of this change on price and quantity. b) Which of the changes in demand and supply is higher?
Toofiq Reply
explain standard reason why economic is a science
innocent Reply
factors influencing supply
Petrus Reply
what is economic.
Milan Reply
scares means__________________ends resources. unlimited
Jan
economics is a science that studies human behaviour as a relationship b/w ends and scares means which have alternative uses
Jan
calculate the profit maximizing for demand and supply
Zarshad Reply
Why qualify 28 supplies
Milan
what are explicit costs
Nomsa Reply
out-of-pocket costs for a firm, for example, payments for wages and salaries, rent, or materials
AI-Robot
concepts of supply in microeconomics
David Reply
economic overview notes
Amahle Reply
identify a demand and a supply curve
Salome Reply
i don't know
Parul
there's a difference
Aryan
Demand curve shows that how supply and others conditions affect on demand of a particular thing and what percent demand increase whith increase of supply of goods
Israr
Hi Sir please how do u calculate Cross elastic demand and income elastic demand?
Abari
Got questions? Join the online conversation and get instant answers!
Jobilize.com Reply
Practice Key Terms 5

Get Jobilize Job Search Mobile App in your pocket Now!

Get it on Google Play Download on the App Store Now


Source:  OpenStax, Algebra and trigonometry. OpenStax CNX. Nov 14, 2016 Download for free at https://legacy.cnx.org/content/col11758/1.6
Google Play and the Google Play logo are trademarks of Google Inc.

Notification Switch

Would you like to follow the 'Algebra and trigonometry' conversation and receive update notifications?

Ask