<< Chapter < Page Chapter >> Page >
This graph shows the line y = 2 on an x.y coordinate plane.  The x-axis runs from negative 5 to 5 and the y-axis runs from – 5 to 5. A horizontal line crosses through the point (0, 2).  Underneath the graph is a table with two rows and six columns.  The top row is labeled: “x” and has the values negative 4, negative 2, 0, 2, and 4. The bottom row is labeled “y” and has the values 2, 2, 2, 2, and 2.
A horizontal line representing the function f ( x ) = 2

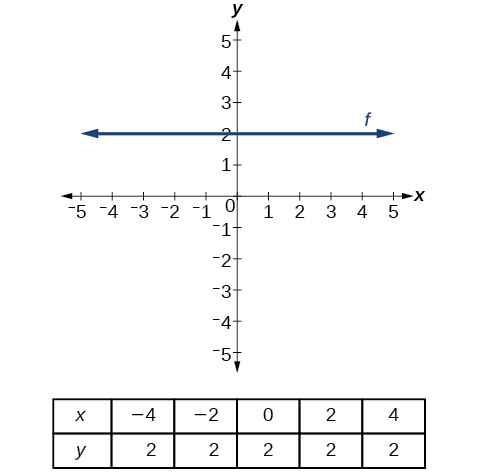
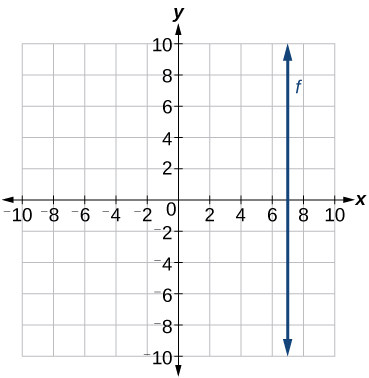
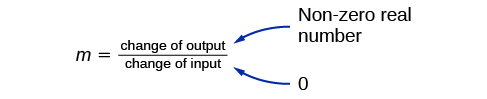
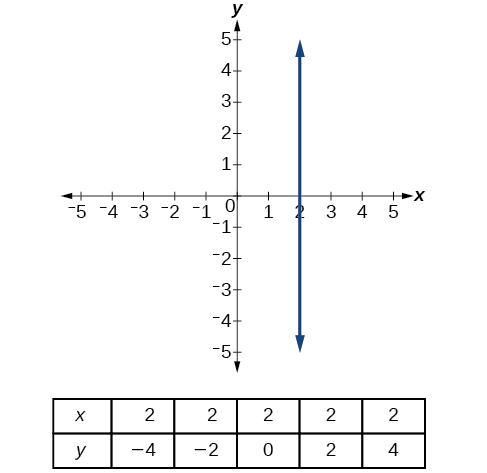
A vertical line    indicates a constant input, or x -value. We can see that the input value for every point on the line is 2, but the output value varies. Because this input value is mapped to more than one output value, a vertical line does not represent a function. Notice that between any two points, the change in the input values is zero. In the slope formula, the denominator will be zero, so the slope of a vertical line is undefined.

This is an image showing when a slope is undefined.  m = change of output divided by the change of input.  The change of output is labeled as: non-zero real number and the change of input is labeled 0.
Example of how a line has a vertical slope. 0 in the denominator of the slope.

A vertical line, such as the one in [link] , has an x -intercept, but no y- intercept unless it’s the line x = 0. This graph represents the line x = 2.

This graph shows a vertical line passing through the point (2, 0) on an x, y coordinate plane. The x-axis runs from negative 5 to 5 and the y-axis runs from negative 5 to 5.  Underneath the graph is a table with two rows and six columns.  The top row is labeled: “x” and has the values 2, 2, 2, 2, and 2. The bottom row is labeled: “y” and has the values negative 4, negative 2, 0, 2, and 4.
The vertical line, x = 2 , which does not represent a function

Horizontal and vertical lines

Lines can be horizontal or vertical.

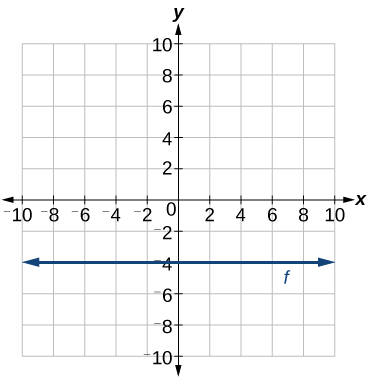
A horizontal line    is a line defined by an equation in the form f ( x ) = b .

A vertical line    is a line defined by an equation in the form x = a .

Writing the equation of a horizontal line

Write the equation of the line graphed in [link] .

This graph shows the function y = negative 4 on  an x, y coordinate plane.  The x-axis runs from negative 10 to 10. The y-axis runs from negative 10 to 10. The horizontal line passes through the point, (0, -4).

For any x -value, the y -value is 4 , so the equation is y = 4.

Got questions? Get instant answers now!

Writing the equation of a vertical line

Write the equation of the line graphed in [link] .

This is a graph showing a line with an undefined slope on an x, y coordinate plane. The x-axis runs from negative 10 to 10 and the y-axis runs from -10 to 10. The line passes through the point (7, 0).

The constant x -value is 7 , so the equation is x = 7.

Got questions? Get instant answers now!

Determining whether lines are parallel or perpendicular

The two lines in [link] are parallel lines    : they will never intersect. They have exactly the same steepness, which means their slopes are identical. The only difference between the two lines is the y -intercept. If we shifted one line vertically toward the other, they would become coincident.

This graph shows two lines on an x, y coordinate plane. The x-axis runs from negative 4 to 6. The y-axis runs from negative 3 to 8.  The first line has the equation y = -3 times x divided by 2 plus 1.  The second line has the equation y = -3 times x divided by 2 plus 7.  The lines do not cross.
Parallel lines

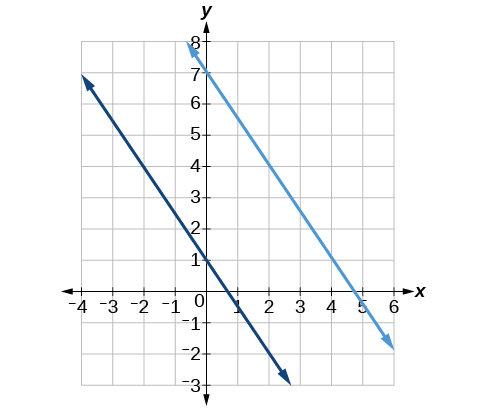
We can determine from their equations whether two lines are parallel by comparing their slopes. If the slopes are the same and the y -intercepts are different, the lines are parallel. If the slopes are different, the lines are not parallel.

f ( x ) = 2 x + 6 f ( x ) = 2 x 4 }  parallel f ( x ) = 3 x + 2 f ( x ) = 2 x + 2 }  not parallel

Unlike parallel lines, perpendicular lines    do intersect. Their intersection forms a right, or 90-degree, angle. The two lines in [link] are perpendicular.

This graph shows two functions perpendicular to each other on an x, y coordinate plane. The first function increases and passes through the points (1, 0) and (0, -5).  The second function decreases and passes through the points (1, 0) and (-4, 1).  The lines intersect to form a 90-degree right angle at the point (1, 0).
Perpendicular lines

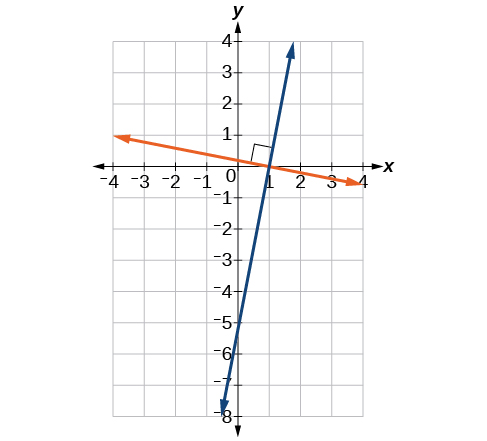
Perpendicular lines do not have the same slope. The slopes of perpendicular lines are different from one another in a specific way. The slope of one line is the negative reciprocal of the slope of the other line. The product of a number and its reciprocal is 1. So, if m 1  and  m 2 are negative reciprocals of one another, they can be multiplied together to yield –1.

m 1 m 2 = −1

To find the reciprocal of a number, divide 1 by the number. So the reciprocal of 8 is 1 8 , and the reciprocal of 1 8 is 8. To find the negative reciprocal, first find the reciprocal and then change the sign.

As with parallel lines, we can determine whether two lines are perpendicular by comparing their slopes, assuming that the lines are neither horizontal nor vertical. The slope of each line below is the negative reciprocal of the other so the lines are perpendicular.

f ( x ) = 1 4 x + 2 negative reciprocal of 1 4  is  −4 f ( x ) = −4 x + 3 negative reciprocal of −4  is  1 4

The product of the slopes is –1.

Questions & Answers

what does mean opportunity cost?
Aster Reply
what is poetive effect of population growth
Solomon Reply
what is inflation
Nasir Reply
what is demand
Eleni
what is economics
IMLAN Reply
economics theory describes individual behavior as the result of a process of optimization under constraints the objective to be reached being determined by
Kalkidan
Economics is a branch of social science that deal with How to wise use of resource ,s
Kassie
need
WARKISA
Economic Needs: In economics, needs are goods or services that are necessary for maintaining a certain standard of living. This includes things like healthcare, education, and transportation.
Kalkidan
What is demand and supply
EMPEROR Reply
deman means?
Alex
what is supply?
Alex
ex play supply?
Alex
Money market is a branch or segment of financial market where short-term debt instruments are traded upon. The instruments in this market includes Treasury bills, Bonds, Commercial Papers, Call money among other.
murana Reply
good
Kayode
what is money market
umar Reply
Examine the distinction between theory of comparative cost Advantage and theory of factor proportion
Fatima Reply
What is inflation
Bright Reply
a general and ongoing rise in the level of prices in an economy
AI-Robot
What are the factors that affect demand for a commodity
Florence Reply
price
Kenu
differentiate between demand and supply giving examples
Lambiv Reply
differentiated between demand and supply using examples
Lambiv
what is labour ?
Lambiv
how will I do?
Venny Reply
how is the graph works?I don't fully understand
Rezat Reply
information
Eliyee
devaluation
Eliyee
t
WARKISA
hi guys good evening to all
Lambiv
multiple choice question
Aster Reply
appreciation
Eliyee
explain perfect market
Lindiwe Reply
In economics, a perfect market refers to a theoretical construct where all participants have perfect information, goods are homogenous, there are no barriers to entry or exit, and prices are determined solely by supply and demand. It's an idealized model used for analysis,
Ezea
Got questions? Join the online conversation and get instant answers!
Jobilize.com Reply

Get Jobilize Job Search Mobile App in your pocket Now!

Get it on Google Play Download on the App Store Now


Source:  OpenStax, Algebra and trigonometry. OpenStax CNX. Nov 14, 2016 Download for free at https://legacy.cnx.org/content/col11758/1.6
Google Play and the Google Play logo are trademarks of Google Inc.

Notification Switch

Would you like to follow the 'Algebra and trigonometry' conversation and receive update notifications?

Ask