<< Chapter < Page Chapter >> Page >

The domain of csc x was given to be all x such that x k π for any integer k . Would the domain of y = A csc ( B x C ) + D be x C + k π B ?

Yes. The excluded points of the domain follow the vertical asymptotes. Their locations show the horizontal shift and compression or expansion implied by the transformation to the original function’s input.

Given a function of the form y = A csc ( B x ) , graph one period.

  1. Express the function given in the form y = A csc ( B x ) .
  2. | A | .
  3. Identify B and determine the period, P = 2 π | B | .
  4. Draw the graph of y = A sin ( B x ) .
  5. Use the reciprocal relationship between y = sin x and y = csc x to draw the graph of y = A csc ( B x ) .
  6. Sketch the asymptotes.
  7. Plot any two reference points and draw the graph through these points.

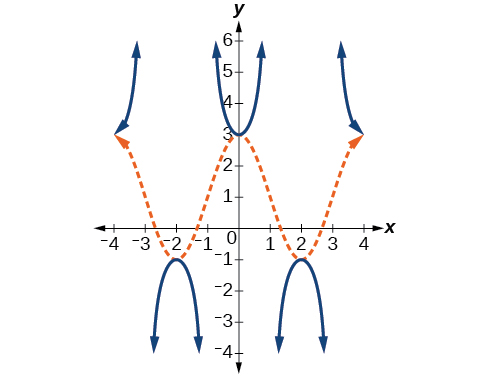
Graphing a variation of the cosecant function

Graph one period of f ( x ) = −3 csc ( 4 x ) .

  • Step 1. The given function is already written in the general form, y = A csc ( B x ) .
  • Step 2. | A | = | 3 | = 3 , so the stretching factor is 3.
  • Step 3. B = 4 , so P = 2 π 4 = π 2 . The period is π 2 units.
  • Step 4. Sketch the graph of the function g ( x ) = −3 sin ( 4 x ) .
  • Step 5. Use the reciprocal relationship of the sine and cosecant functions to draw the cosecant function .
  • Steps 6–7. Sketch three asymptotes at x = 0 , x = π 4 , and x = π 2 . We can use two reference points, the local maximum at ( π 8 , −3 ) and the local minimum at ( 3 π 8 , 3 ) . [link] shows the graph.
    A graph of one period of a cosecant function. There are vertical asymptotes at x=0, x=pi/4, and x=pi/2.
Got questions? Get instant answers now!

Graph one period of f ( x ) = 0.5 csc ( 2 x ) .

A graph of one period of a modified secant function, which looks like an downward facing prarbola and a upward facing parabola.
Got questions? Get instant answers now!

Given a function of the form f ( x ) = A csc ( B x C ) + D , graph one period.

  1. Express the function given in the form y = A csc ( B x C ) + D .
  2. Identify the stretching/compressing factor, | A | .
  3. Identify B and determine the period, 2 π | B | .
  4. Identify C and determine the phase shift, C B .
  5. Draw the graph of y = A csc ( B x ) but shift it to the right by and up by D .
  6. Sketch the vertical asymptotes, which occur at x = C B + π | B | k , where k is an integer.

Graphing a vertically stretched, horizontally compressed, and vertically shifted cosecant

Sketch a graph of y = 2 csc ( π 2 x ) + 1. What are the domain and range of this function?

  • Step 1. Express the function given in the form y = 2 csc ( π 2 x ) + 1.
  • Step 2. Identify the stretching/compressing factor, | A | = 2.
  • Step 3. The period is 2 π | B | = 2 π π 2 = 2 π 1 2 π = 4.
  • Step 4. The phase shift is 0 π 2 = 0.
  • Step 5. Draw the graph of y = A csc ( B x ) but shift it up D = 1.
  • Step 6. Sketch the vertical asymptotes, which occur at x = 0 , x = 2 , x = 4.

The graph for this function is shown in [link] .

A graph of 3 periods of a modified cosecant function, with 3 vertical asymptotes, and a dotted sinusoidal function that has local maximums where the cosecant function has local minimums and local minimums where the cosecant function has local maximums.
A transformed cosecant function
Got questions? Get instant answers now!

Given the graph of f ( x ) = 2 cos ( π 2 x ) + 1 shown in [link] , sketch the graph of g ( x ) = 2 sec ( π 2 x ) + 1 on the same axes.

A graph of two periods of a modified cosine function. Range is [-1,3], graphed from x=-4 to x=4.
A graph of two periods of both a secant and consine function. Grpah shows that cosine function has local maximums where secant function has local minimums and vice versa.
Got questions? Get instant answers now!

Analyzing the graph of y = cot x

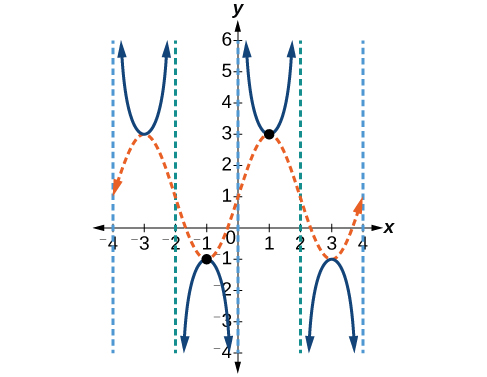
The last trigonometric function we need to explore is cotangent    . The cotangent is defined by the reciprocal identity cot x = 1 tan x . Notice that the function is undefined when the tangent function is 0, leading to a vertical asymptote in the graph at 0 , π , etc. Since the output of the tangent function is all real numbers, the output of the cotangent function is also all real numbers.

We can graph y = cot x by observing the graph of the tangent function because these two functions are reciprocals of one another. See [link] . Where the graph of the tangent function decreases, the graph of the cotangent function increases. Where the graph of the tangent function increases, the graph of the cotangent function decreases.

Questions & Answers

what does mean opportunity cost?
Aster Reply
what is poetive effect of population growth
Solomon Reply
what is inflation
Nasir Reply
what is demand
Eleni
what is economics
IMLAN Reply
economics theory describes individual behavior as the result of a process of optimization under constraints the objective to be reached being determined by
Kalkidan
Economics is a branch of social science that deal with How to wise use of resource ,s
Kassie
need
WARKISA
Economic Needs: In economics, needs are goods or services that are necessary for maintaining a certain standard of living. This includes things like healthcare, education, and transportation.
Kalkidan
What is demand and supply
EMPEROR Reply
deman means?
Alex
what is supply?
Alex
ex play supply?
Alex
Money market is a branch or segment of financial market where short-term debt instruments are traded upon. The instruments in this market includes Treasury bills, Bonds, Commercial Papers, Call money among other.
murana Reply
good
Kayode
what is money market
umar Reply
Examine the distinction between theory of comparative cost Advantage and theory of factor proportion
Fatima Reply
What is inflation
Bright Reply
a general and ongoing rise in the level of prices in an economy
AI-Robot
What are the factors that affect demand for a commodity
Florence Reply
price
Kenu
differentiate between demand and supply giving examples
Lambiv Reply
differentiated between demand and supply using examples
Lambiv
what is labour ?
Lambiv
how will I do?
Venny Reply
how is the graph works?I don't fully understand
Rezat Reply
information
Eliyee
devaluation
Eliyee
t
WARKISA
hi guys good evening to all
Lambiv
multiple choice question
Aster Reply
appreciation
Eliyee
explain perfect market
Lindiwe Reply
In economics, a perfect market refers to a theoretical construct where all participants have perfect information, goods are homogenous, there are no barriers to entry or exit, and prices are determined solely by supply and demand. It's an idealized model used for analysis,
Ezea
Got questions? Join the online conversation and get instant answers!
Jobilize.com Reply

Get Jobilize Job Search Mobile App in your pocket Now!

Get it on Google Play Download on the App Store Now


Source:  OpenStax, Algebra and trigonometry. OpenStax CNX. Nov 14, 2016 Download for free at https://legacy.cnx.org/content/col11758/1.6
Google Play and the Google Play logo are trademarks of Google Inc.

Notification Switch

Would you like to follow the 'Algebra and trigonometry' conversation and receive update notifications?

Ask