

| << Chapter < Page | Chapter >> Page > |
In [link] recall that the amount of time between customers is exponentially distributed with a mean of two minutes ( X ~ Exp (0.5)). Suppose that five minutes have elapsed since the last customer arrived. Since an unusually long amount of time has now elapsed, it would seem to be more likely for a customer to arrive within the next minute. With the exponential distribution, this is not the case–the additional time spent waiting for the next customer does not depend on how much time has already elapsed since the last customer. This is referred to as the memoryless property . Specifically, the memoryless property says that
P ( X > r + t | X > r ) = P ( X > t ) for all r ≥ 0 and t ≥ 0
For example, if five minutes has elapsed since the last customer arrived, then the probability that more than one minute will elapse before the next customer arrives is computed by using r = 5 and t = 1 in the foregoing equation.
P ( X >5 + 1 | X >5) = P ( X >1) = ≈ 0.6065.
This is the same probability as that of waiting more than one minute for a customer to arrive after the previous arrival.
The exponential distribution is often used to model the longevity of an electrical or mechanical device. In [link] , the lifetime of a certain computer part has the exponential distribution with a mean of ten years ( X ~ Exp (0.1)). The memoryless property says that knowledge of what has occurred in the past has no effect on future probabilities. In this case it means that an old part is not any more likely to break down at any particular time than a brand new part. In other words, the part stays as good as new until it suddenly breaks. For example, if the part has already lasted ten years, then the probability that it lasts another seven years is P ( X >17| X >10) = P ( X >7) = 0.4966.
Refer to
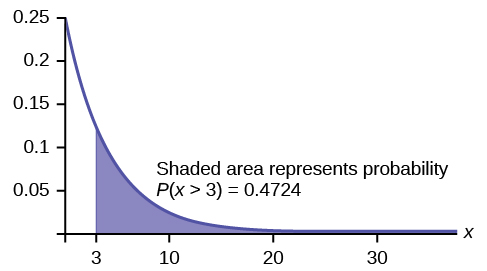
[link] where the time a postal clerk spends with his or her customer has an exponential distribution with a mean of four minutes. Suppose a customer has spent four minutes with a postal clerk. What is the probability that he or she will spend at least an additional three minutes with the postal clerk?
The decay parameter of X is m = = 0.25, so X ∼ Exp (0.25).
The cumulative distribution function is P ( X < x ) = 1 – e –0.25 x .
We want to find P ( X >7| X >4). The memoryless property says that P ( X >7| X >4) = P ( X >3), so we just need to find the probability that a customer spends more than three minutes with a postal clerk.
This is P ( X >3) = 1 – P ( X <3) = 1 – (1 – e –0.25⋅3 ) = e –0.75 ≈ 0.4724.
1–(1–e^(–0.25*2)) = e^(–0.25*2).
Suppose that the longevity of a light bulb is exponential with a mean lifetime of eight years. If a bulb has already lasted 12 years, find the probability that it will last a total of over 19 years.
Let T = the lifetime of the light bulb. Then T ∼ Exp .
The cumulative distribution function is P ( T < t ) = 1 −
We need to find P ( T >19| T = 12). By the memoryless property ,
P ( T >19| T = 12) = P ( T >7) = 1 – P ( T <7) = 1 – (1 – e –7/8 )= e -7/8 ≈ 0.4169.
1 – (1 – e^(–7/8)) = e^(–7/8).
There is an interesting relationship between the exponential distribution and the Poisson distribution. Suppose that the time that elapses between two successive events follows the exponential distribution with a mean of μ units of time. Also assume that these times are independent, meaning that the time between events is not affected by the times between previous events. If these assumptions hold, then the number of events per unit time follows a Poisson distribution with mean λ = 1/μ. Recall from the chapter on Discrete Random Variables that if X has the Poisson distribution with mean λ , then . Conversely, if the number of events per unit time follows a Poisson distribution, then the amount of time between events follows the exponential distribution. ( k ! = k *( k -1*)( k –2)*( k -3)…3*2*1)
Notification Switch
Would you like to follow the 'Introductory statistics' conversation and receive update notifications?

|
|
|
|
|

|
|

|
|

|
|

|
|

|
|

|
|

|
|

|
|

|
|

|