<< Chapter < Page Chapter >> Page >

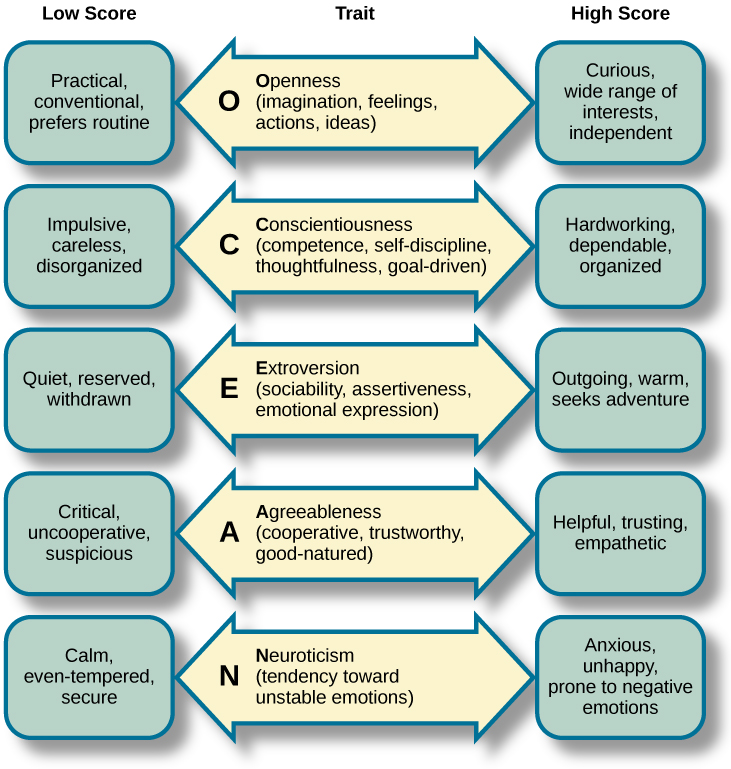
More recently, the study of personality has taken on a more quantitative approach. Rather than explaining how personality arises, research is focused on identifying personality traits , measuring these traits, and determining how these traits interact in a particular context to determine how a person will behave in any given situation. Personality traits are relatively consistent patterns of thought and behavior, and many have proposed that five trait dimensions are sufficient to capture the variations in personality seen across individuals. These five dimensions are known as the “Big Five” or the Five Factor model , and include dimensions of conscientiousness, agreeableness, neuroticism, openness, and extraversion ( [link] ). Each of these traits has been demonstrated to be relatively stable over the lifespan (e.g., Rantanen, Metsäpelto, Feldt, Pulkinnen, and Kokko, 2007; Soldz&Vaillant, 1999; McCrae&Costa, 2008) and is influenced by genetics (e.g., Jang, Livesly, and Vernon, 1996).

A diagram includes five vertically stacked arrows, which point to the left and right. A dimension's first letter, name, and description are included inside of each arrow. A box to the left of each arrow includes traits associated with a low score for that arrow's dimension. A box to the right of each arrow includes traits associated with a high score for that arrow's dimension. The top arrow includes the trait “openness,” which is described with the words, “imagination,” “feelings,” “actions,” and “ideas.” The box to the left of that arrow includes the words, “practical,” “conventional,” and “prefers routine,” while the box to the right of that arrow includes the words, “curious,” “wide range of interests,” and “independent.” The next arrow includes the trait “conscientiousness,” which is described with the words, “competence,” “self-discipline,” “thoughtfulness,” and “goal-driven.” The box to the left of that arrow includes the words, “impulsive,” “careless,” and “disorganized,” while the box to the right of that arrow includes the words, “hardworking,” “dependable,” and “organized.” The next arrow includes the trait “extroversion,” which is described with the words, “sociability,” “assertiveness,” and “emotional expression.” The box to the left of that arrow includes the words, “quiet,” “reserved,” and “withdrawn,” while the box to the right of that arrow includes the words, “outgoing,” “warm,” and “seeks adventure.” The next arrow includes the trait “agreeableness,” which is described with the words, “cooperative,” “trustworthy,” and “good-natured.” The box to the left of that arrow includes the words, “critical,” “uncooperative,” and “suspicious,” while the box to the right of that arrow includes the words, “helpful,” “trusting,” and “empathetic.” The next arrow includes the trait “neuroticism,” which is described as “tendency toward unstable emotions.” The box to the left of that arrow includes the words, “calm,” “even-tempered,” and “secure,” while the box to the right of that arrow includes the words, “anxious,” “unhappy,” and “prone to negative emotions.”
Each of the dimensions of the Five Factor model is shown in this figure. The provided description would describe someone who scored highly on that given dimension. Someone with a lower score on a given dimension could be described in opposite terms.

Social psychology

Social psychology focuses on how we interact with and relate to others. Social psychologists conduct research on a wide variety of topics that include differences in how we explain our own behavior versus how we explain the behaviors of others, prejudice, and attraction, and how we resolve interpersonal conflicts. Social psychologists have also sought to determine how being among other people changes our own behavior and patterns of thinking.

There are many interesting examples of social psychological research, and you will read about many of these in a later chapter of this textbook. Until then, you will be introduced to one of the most controversial psychological studies ever conducted. Stanley Milgram was an American social psychologist who is most famous for research that he conducted on obedience. After the holocaust, in 1961, a Nazi war criminal, Adolf Eichmann, who was accused of committing mass atrocities, was put on trial. Many people wondered how German soldiers were capable of torturing prisoners in concentration camps, and they were unsatisfied with the excuses given by soldiers that they were simply following orders. At the time, most psychologists agreed that few people would be willing to inflict such extraordinary pain and suffering, simply because they were obeying orders. Milgram decided to conduct research to determine whether or not this was true ( [link] ). As you will read later in the text, Milgram found that nearly two-thirds of his participants were willing to deliver what they believed to be lethal shocks to another person, simply because they were instructed to do so by an authority figure (in this case, a man dressed in a lab coat). This was in spite of the fact that participants received payment for simply showing up for the research study and could have chosen not to inflict pain or more serious consequences on another person by withdrawing from the study. No one was actually hurt or harmed in any way, Milgram’s experiment was a clever ruse that took advantage of research confederates, those who pretend to be participants in a research study who are actually working for the researcher and have clear, specific directions on how to behave during the research study (Hock, 2009). Milgram’s and others’ studies that involved deception and potential emotional harm to study participants catalyzed the development of ethical guidelines for conducting psychological research that discourage the use of deception of research subjects, unless it can be argued not to cause harm and, in general, requiring informed consent of participants.

Questions & Answers

how do you get the 2/50
Abba Reply
number of sport play by 50 student construct discrete data
Aminu Reply
width of the frangebany leaves on how to write a introduction
Theresa Reply
Solve the mean of variance
Veronica Reply
Step 1: Find the mean. To find the mean, add up all the scores, then divide them by the number of scores. ... Step 2: Find each score's deviation from the mean. ... Step 3: Square each deviation from the mean. ... Step 4: Find the sum of squares. ... Step 5: Divide the sum of squares by n – 1 or N.
kenneth
what is error
Yakuba Reply
Is mistake done to something
Vutshila
Hy
anas
hy
What is the life teble
anas
hy
Jibrin
statistics is the analyzing of data
Tajudeen Reply
what is statics?
Zelalem Reply
how do you calculate mean
Gloria Reply
diveving the sum if all values
Shaynaynay
let A1,A2 and A3 events be independent,show that (A1)^c, (A2)^c and (A3)^c are independent?
Fisaye Reply
what is statistics
Akhisani Reply
data collected all over the world
Shaynaynay
construct a less than and more than table
Imad Reply
The sample of 16 students is taken. The average age in the sample was 22 years with astandard deviation of 6 years. Construct a 95% confidence interval for the age of the population.
Aschalew Reply
Bhartdarshan' is an internet-based travel agency wherein customer can see videos of the cities they plant to visit. The number of hits daily is a normally distributed random variable with a mean of 10,000 and a standard deviation of 2,400 a. what is the probability of getting more than 12,000 hits? b. what is the probability of getting fewer than 9,000 hits?
Akshay Reply
Bhartdarshan'is an internet-based travel agency wherein customer can see videos of the cities they plan to visit. The number of hits daily is a normally distributed random variable with a mean of 10,000 and a standard deviation of 2,400. a. What is the probability of getting more than 12,000 hits
Akshay
1
Bright
Sorry i want to learn more about this question
Bright
Someone help
Bright
a= 0.20233 b=0.3384
Sufiyan
a
Shaynaynay
How do I interpret level of significance?
Mohd Reply
It depends on your business problem or in Machine Learning you could use ROC- AUC cruve to decide the threshold value
Shivam
how skewness and kurtosis are used in statistics
Owen Reply
yes what is it
Taneeya
Got questions? Join the online conversation and get instant answers!
Jobilize.com Reply

Get Jobilize Job Search Mobile App in your pocket Now!

Get it on Google Play Download on the App Store Now


Source:  OpenStax, Psychology. OpenStax CNX. Feb 03, 2015 Download for free at https://legacy.cnx.org/content/col11629/1.5
Google Play and the Google Play logo are trademarks of Google Inc.

Notification Switch

Would you like to follow the 'Psychology' conversation and receive update notifications?

Ask