<< Chapter < Page Chapter >> Page >

Sketch the graph of r = 3 2 cos θ .

Graph of the limaçon r=3-2cos(theta). Extending to the left.
Got questions? Get instant answers now!

Another type of limaçon, the inner-loop limaçon , is named for the loop formed inside the general limaçon shape. It was discovered by the German artist Albrecht Dürer (1471-1528), who revealed a method for drawing the inner-loop limaçon in his 1525 book Underweysung der Messing . A century later, the father of mathematician Blaise Pascal , Étienne Pascal(1588-1651), rediscovered it.

Formulas for inner-loop limaçons

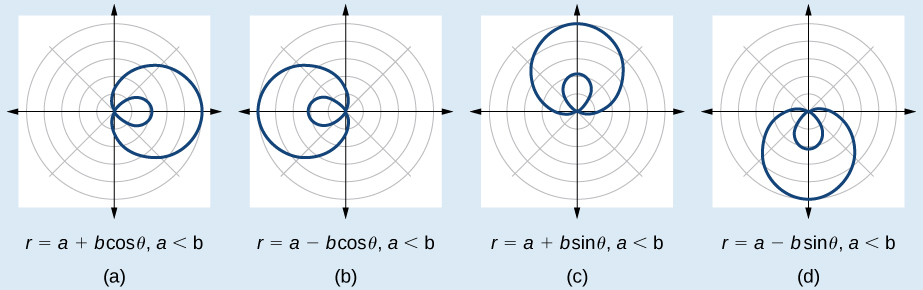
The formulas that generate the inner-loop limaçons are given by r = a ± b cos θ and r = a ± b sin θ where a > 0 , b > 0 , and a < b . The graph of the inner-loop limaçon passes through the pole twice: once for the outer loop, and once for the inner loop. See [link] for the graphs.
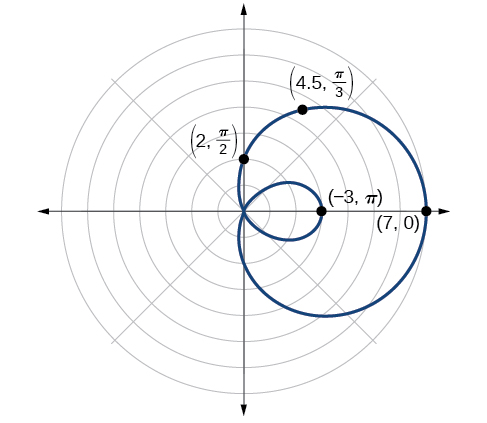
Graph of four inner loop limaçons side by side. (A) is r=a+bcos(theta),a<b. Extended to the right. (B) is a-bcos(theta), a<b. Extends to the left. (C) is r=a+bsin(theta), a<b. Extends up. (D) is r=a-bsin(theta), a<b. Extends down.

Sketching the graph of an inner-loop limaçon

Sketch the graph of r = 2 + 5 cos θ .

Testing for symmetry, we find that the graph of the equation is symmetric about the polar axis. Next, finding the zeros reveals that when r = 0 , θ = 1.98. The maximum | r | is found when cos θ = 1 or when θ = 0. Thus, the maximum is found at the point (7, 0).

Even though we have found symmetry, the zero, and the maximum, plotting more points will help to define the shape, and then a pattern will emerge.

See [link] .

θ 0 π 6 π 3 π 2 2 π 3 5 π 6 π 7 π 6 4 π 3 3 π 2 5 π 3 11 π 6 2 π
r 7 6.3 4.5 2 −0.5 −2.3 −3 −2.3 −0.5 2 4.5 6.3 7

As expected, the values begin to repeat after θ = π . The graph is shown in [link] .

Graph of inner loop limaçon r=2+5cos(theta). Extends to the right. Points on edge plotted are (7,0), (4.5, pi/3), (2, pi/2), and (-3, pi).
Inner-loop limaçon
Got questions? Get instant answers now!

Investigating lemniscates

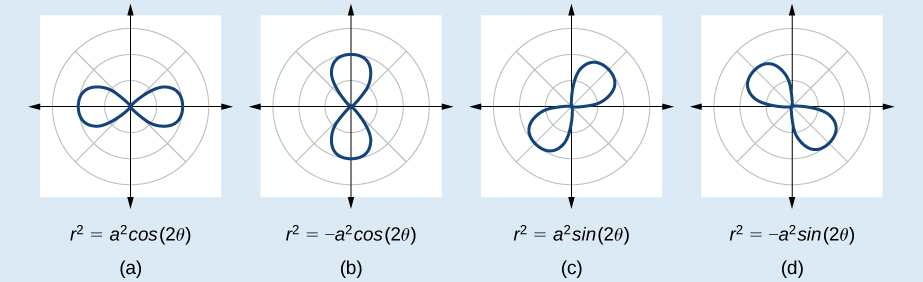
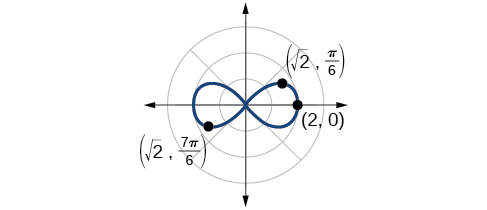
The lemniscate is a polar curve resembling the infinity symbol or a figure 8. Centered at the pole, a lemniscate is symmetrical by definition.

Formulas for lemniscates

The formulas that generate the graph of a lemniscate    are given by r 2 = a 2 cos 2 θ and r 2 = a 2 sin 2 θ where a 0. The formula r 2 = a 2 sin 2 θ is symmetric with respect to the pole. The formula r 2 = a 2 cos 2 θ is symmetric with respect to the pole, the line θ = π 2 , and the polar axis. See [link] for the graphs.
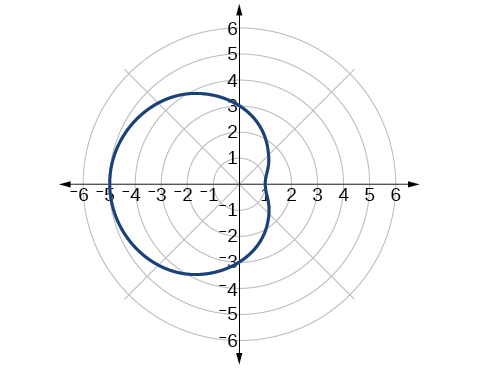
Four graphs of lemniscates side by side. (A) is r^2 = a^2 * cos(2theta). Horizonatal figure eight, on x-axis. (B) is r^2 = - a^2 * cos(2theta). Vertical figure eight, on y axis. (C) is r^2 = a^2 * sin(2theta). Diagonal figure eight on line y=x. (D) is r^2 = -a^2 *sin(2theta). Diagonal figure eight on line y=-x.

Sketching the graph of a lemniscate

Sketch the graph of r 2 = 4 cos 2 θ .

The equation exhibits symmetry with respect to the line θ = π 2 , the polar axis, and the pole.

Let’s find the zeros. It should be routine by now, but we will approach this equation a little differently by making the substitution u = 2 θ .

0 = 4 cos 2 θ 0 = 4 cos u 0 = cos u cos 1 0 = π 2 u = π 2 Substitute  2 θ  back in for  u . 2 θ = π 2 θ = π 4

So, the point ( 0 , π 4 ) is a zero of the equation.

Now let’s find the maximum value. Since the maximum of cos u = 1 when u = 0 , the maximum cos 2 θ = 1 when 2 θ = 0. Thus,

r 2 = 4 cos ( 0 ) r 2 = 4 ( 1 ) = 4 r = ± 4 = 2

We have a maximum at (2, 0). Since this graph is symmetric with respect to the pole, the line θ = π 2 , and the polar axis, we only need to plot points in the first quadrant.

Make a table similar to [link] .

θ 0 π 6 π 4 π 3 π 2
r 2 2 0 2 0

Plot the points on the graph, such as the one shown in [link] .

Graph of r^2 = 4cos(2theta). Horizontal lemniscate, along x-axis. Points on edge plotted are (2,0), (rad2, pi/6), (rad2 7pi/6).
Lemniscate
Got questions? Get instant answers now!

Investigating rose curves

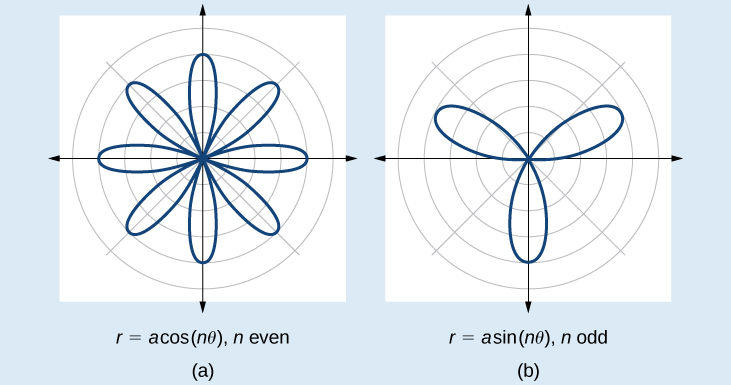
The next type of polar equation produces a petal-like shape called a rose curve. Although the graphs look complex, a simple polar equation generates the pattern.

Rose curves

The formulas that generate the graph of a rose curve    are given by r = a cos n θ and r = a sin n θ where a 0. If n is even, the curve has 2 n petals. If n is odd, the curve has n petals. See [link] .

Graph of two rose curves side by side. (A) is r=acos(ntheta), where n is even. Eight petals extending from origin, equally spaced. (B) is r=asin(ntheta) where n is odd. Three petals extending from the origin, equally spaced.

Questions & Answers

what does mean opportunity cost?
Aster Reply
what is poetive effect of population growth
Solomon Reply
what is inflation
Nasir Reply
what is demand
Eleni
what is economics
IMLAN Reply
economics theory describes individual behavior as the result of a process of optimization under constraints the objective to be reached being determined by
Kalkidan
Economics is a branch of social science that deal with How to wise use of resource ,s
Kassie
need
WARKISA
Economic Needs: In economics, needs are goods or services that are necessary for maintaining a certain standard of living. This includes things like healthcare, education, and transportation.
Kalkidan
What is demand and supply
EMPEROR Reply
deman means?
Alex
what is supply?
Alex
ex play supply?
Alex
Money market is a branch or segment of financial market where short-term debt instruments are traded upon. The instruments in this market includes Treasury bills, Bonds, Commercial Papers, Call money among other.
murana Reply
good
Kayode
what is money market
umar Reply
Examine the distinction between theory of comparative cost Advantage and theory of factor proportion
Fatima Reply
What is inflation
Bright Reply
a general and ongoing rise in the level of prices in an economy
AI-Robot
What are the factors that affect demand for a commodity
Florence Reply
price
Kenu
differentiate between demand and supply giving examples
Lambiv Reply
differentiated between demand and supply using examples
Lambiv
what is labour ?
Lambiv
how will I do?
Venny Reply
how is the graph works?I don't fully understand
Rezat Reply
information
Eliyee
devaluation
Eliyee
t
WARKISA
hi guys good evening to all
Lambiv
multiple choice question
Aster Reply
appreciation
Eliyee
explain perfect market
Lindiwe Reply
In economics, a perfect market refers to a theoretical construct where all participants have perfect information, goods are homogenous, there are no barriers to entry or exit, and prices are determined solely by supply and demand. It's an idealized model used for analysis,
Ezea
Got questions? Join the online conversation and get instant answers!
Jobilize.com Reply
Practice Key Terms 9

Get Jobilize Job Search Mobile App in your pocket Now!

Get it on Google Play Download on the App Store Now


Source:  OpenStax, Precalculus. OpenStax CNX. Jan 19, 2016 Download for free at https://legacy.cnx.org/content/col11667/1.6
Google Play and the Google Play logo are trademarks of Google Inc.

Notification Switch

Would you like to follow the 'Precalculus' conversation and receive update notifications?

Ask