

| << Chapter < Page | Chapter >> Page > |
Listing 23 . Source code for the program named VectorAdd03.
/*VectorAdd03.java
Copyright 2008, R.G.BaldwinRevised 02/14/08
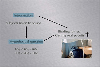
This program illustrates the fact that the length of thesum of two vectors is not necessarily equal to the sum of
the lengths of the two vectors. Two vectors are added suchand the length of the sum is much smaller than the length
of either of the original vectors. The red and greenvectors shown in the screen output are added producing the
black vector. The lengths of all three vectors aredisplayed on the command-line screen, demonstrating that
the length of the black vector is much less than thelength of either the red vector or the blue vector.
The only thing that is new in this program is thegetLength method of the GM2D04.Vector class.
Tested using JDK 1.6 under WinXP.*********************************************************/
import java.awt.*;import javax.swing.*;
import java.awt.geom.*;class VectorAdd03{
public static void main(String[]args){
GUI guiObj = new GUI();}//end main
}//end controlling class VectorAdd03//======================================================//
class GUI extends JFrame{//Specify the horizontal and vertical size of a JFrame
// object.int hSize = 225;
int vSize = 225;Image osi;//an off-screen image
int osiWidth;//off-screen image widthint osiHeight;//off-screen image height
MyCanvas myCanvas;//a subclass of CanvasGUI(){//constructor//Set JFrame size, title, and close operation.
setSize(hSize,vSize);setTitle("Copyright 2008,R.G.Baldwin");
setDefaultCloseOperation(JFrame.EXIT_ON_CLOSE);//Create a new drawing canvas and add it to the// center of the JFrame.
myCanvas = new MyCanvas();this.getContentPane().add(myCanvas);//This object must be visible before you can get an
// off-screen image. It must also be visible before// you can compute the size of the canvas.
setVisible(true);osiWidth = myCanvas.getWidth();
osiHeight = myCanvas.getHeight();//Create an off-screen image and get a graphics
// context on it.osi = createImage(osiWidth,osiHeight);
Graphics2D g2D = (Graphics2D)(osi.getGraphics());//Draw some graphical objects on the off-screen// image that represent underlying data objects in
// 2D space.drawOffScreen(g2D);
//Cause the overridden paint method belonging to// myCanvas to be executed.
myCanvas.repaint();}//end constructor
//----------------------------------------------------////The purpose of this method is to add some Vector// objects and to cause visual manifestations of the raw
// Vector objects and the resultant Vector objects to be// drawn onto an off-screen image.
void drawOffScreen(Graphics2D g2D){//Translate the origin and draw a pair of orthogonal// axes that intersect at the origin.
setCoordinateFrame(g2D);//Define two vectors.GM2D04.Vector vecA = new GM2D04.Vector(
new GM2D04.ColMatrix(50,-100));GM2D04.Vector vecB = new GM2D04.Vector(
new GM2D04.ColMatrix(-35,110));//Define a third vector as the sum of the first// two vectors defined above.
GM2D04.Vector sumOf2 = vecA.add(vecB);//Draw vecA in RED with its tail at the origing2D.setColor(Color.RED);
vecA.draw(g2D,new GM2D04.Point(new GM2D04.ColMatrix(0,0)));//Draw vecB in GREEN with its tail at the head of vecAg2D.setColor(Color.GREEN);
vecB.draw(g2D,new GM2D04.Point(new GM2D04.ColMatrix(vecA.getData(0),vecA.getData(1))));//Draw sumOf2 in BLACK with its tail at the origin.
// The head will coincide with the head of vecB.g2D.setColor(Color.BLACK);
sumOf2.draw(g2D,new GM2D04.Point(new GM2D04.ColMatrix(0.0,0.0)));System.out.println(
"Red length = " + vecA.getLength());System.out.println(
"Green length = " + vecB.getLength());System.out.println(
"Black length = " + sumOf2.getLength());}//end drawOffScreen
//----------------------------------------------------////This method is used to set the origin of the
// off-screen image and to draw orthogonal axes that// intersect at the origin.
private void setCoordinateFrame(Graphics2D g2D){//Translate the origin to a point near the lower-left
// corner of the off-screen image.g2D.translate(0.2*osiWidth,0.8*osiHeight);
//Draw new X and Y-axes in default BLACKg2D.drawLine(-(int)(0.2*osiWidth),0,
(int)(0.8*osiWidth),0);g2D.drawLine(0,-(int)(0.8*osiHeight),0,(int)(0.2*osiHeight));}//end setCoordinateFrame method
//====================================================////This is an inner class of the GUI class.
class MyCanvas extends Canvas{//Override the paint() method. This method will be
// called when the JFrame and the Canvas appear on the// screen or when the repaint method is called on the
// Canvas object.//The purpose of this method is to display the
// off-screen image on the screen.public void paint(Graphics g){
g.drawImage(osi,0,0,this);}//end overridden paint()}//end inner class MyCanvas}//end class GUI
//======================================================//
Notification Switch
Would you like to follow the 'Game 2302 - mathematical applications for game development' conversation and receive update notifications?

|
|

|
|

|
|

|
|

|
|

|
|

|
|
|
|

|
|

|