<< Chapter < Page Chapter >> Page >

The applications of the QCM-D ranges from the deposition of nanoparticles into a surface, from the interaction of proteins within certain substrates. It can also monitors the bacterial amount of products when feed with different molecules, as the flexibility of the sensors into what can be deposited in them include nanoparticle, special functionalization or even cell and bacterias!

Experimental planning

In order to use QCM-D for studing the interaction of nanoparticles with a specific surface several steps must be followed. For demonstration purposes the following procedure will describe the use of a Q-Sense E4 with autosampler from Biolin Scientific. A summary is shown below as a quick guide to follow, but further details will be explained:

  1. Surface election and cleaning according with the manufacturer recommendations.
  2. Sample preparation including having the correct dilutions and enough sample for the running experiment.
  3. Equipment cleaning and set up of the correct parameters for the experiment.
  4. Data acquisition.
  5. Data interpretation.

Surface election

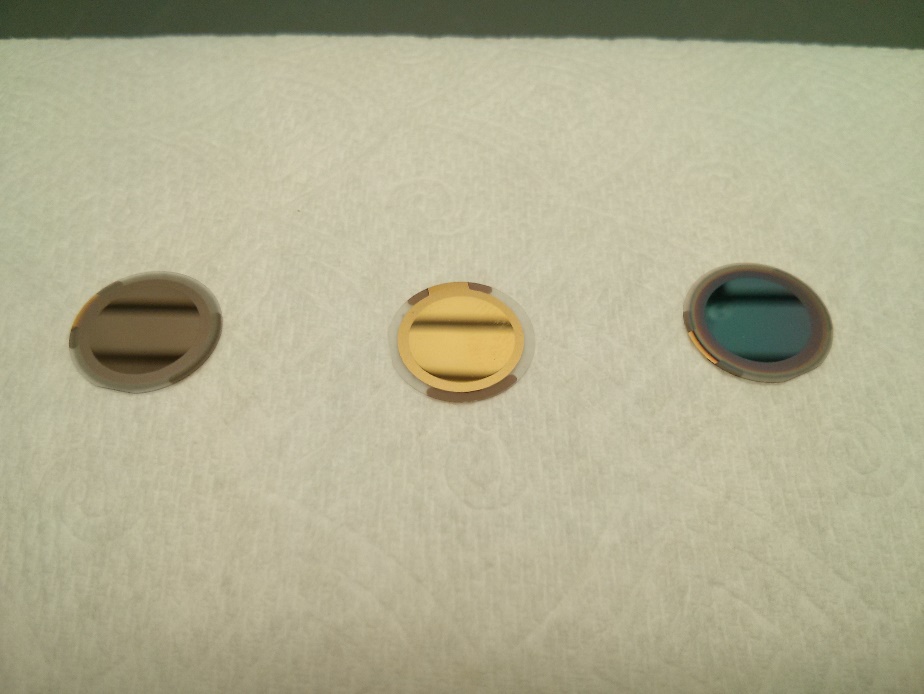
The decision of what surface of the the sensor to use is the most important decision to make fore each study. Biolin has a large library of available coatings ranging from different compositions of pure elements and oxides ( [link] ) to specific binding proteins. It is important to take into account the different chemistries of the sensors and the results we are looking for. For example studying a protein with high sulfur content on a gold sensor can lead to a false deposition results, as gold and sulfur have a high affinity to form bonds. For the purpose of this example, a gold coated sensor will be used in the remainder of the discussion.

From left to right, silica (SiO 2 ), gold (Au), and iron oxide (Fe 2 O 3 ) coated sensors. Each one is 1 cm in diameter.

Sensor cleaning

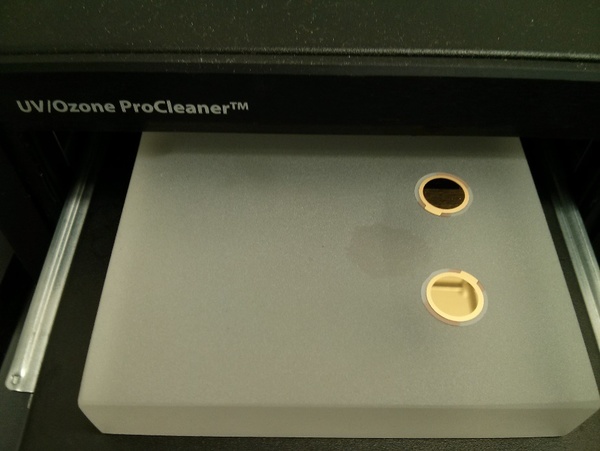
Since QCM-D relies on the amount of mass that is deposited into the surface of the sensor, a thorough cleaning is needed to ensure there is no contaminants on the surface that can lead to errors in the measurement. The procedure the manufacturer established to clean a gold sensor is as follows:

  1. Put the sensor in the UV/ozone chamber for 10 minutes
  2. Prepare 10 mL of a 5:1:1 solution of hydrogen peroxide:ammonia:water
  3. Submerge in this solution at 75 °C for 5 minutes.
  4. Rinse with copious amount of milliQ water.
  5. Dry with inert gas.
  6. Put the sensor in the UV/ozone chamber for 10 minutes as shown in [link] .
Gold sensors in loader of the UV/ozone chamber in the final step of the cleaning process.

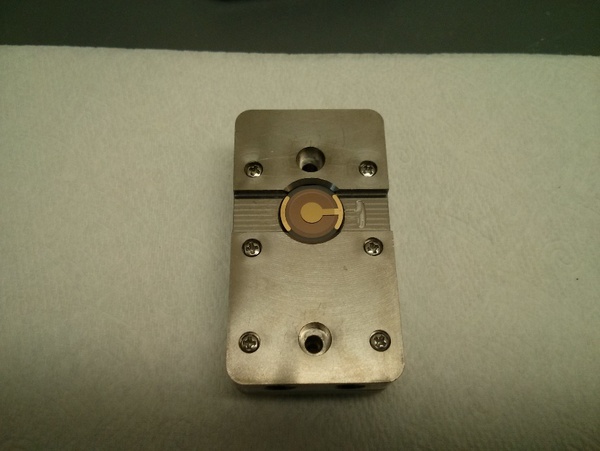
Once the sensors are clean, extreme caution should be taken to avoid contamination of the surface. The sensors can be loaded in the flow chamber of the equipment making sure that the T-mark of the sensor matches the T mark of the chamber in order to make sure the electrodes are in constant contact. The correct position is shown in [link] .

Correct position of the sensor in the chamber.

Sample preparation

As the top range of mass that can be detected is merely micrograms, solutions must be prepared accordingly. For a typical run, a buffer solution is needed in which the deposition will be studied as well as, the sample itself and a solution of 2% of sodium dodecylsulfate [CH 3 (CH 2 ) 10 CH 2 OSO 3 Na, SDS]. For this example we will be using nanoparticles of magnetic iron oxide (nMag) coated with PAMS, and as a buffer 8% NaCl in DI water.

Questions & Answers

differentiate between demand and supply giving examples
Lambiv Reply
differentiated between demand and supply using examples
Lambiv
what is labour ?
Lambiv
how will I do?
Venny Reply
how is the graph works?I don't fully understand
Rezat Reply
information
Eliyee
devaluation
Eliyee
t
WARKISA
hi guys good evening to all
Lambiv
multiple choice question
Aster Reply
appreciation
Eliyee
explain perfect market
Lindiwe Reply
In economics, a perfect market refers to a theoretical construct where all participants have perfect information, goods are homogenous, there are no barriers to entry or exit, and prices are determined solely by supply and demand. It's an idealized model used for analysis,
Ezea
What is ceteris paribus?
Shukri Reply
other things being equal
AI-Robot
When MP₁ becomes negative, TP start to decline. Extuples Suppose that the short-run production function of certain cut-flower firm is given by: Q=4KL-0.6K2 - 0.112 • Where is quantity of cut flower produced, I is labour input and K is fixed capital input (K-5). Determine the average product of lab
Kelo
Extuples Suppose that the short-run production function of certain cut-flower firm is given by: Q=4KL-0.6K2 - 0.112 • Where is quantity of cut flower produced, I is labour input and K is fixed capital input (K-5). Determine the average product of labour (APL) and marginal product of labour (MPL)
Kelo
yes,thank you
Shukri
Can I ask you other question?
Shukri
what is monopoly mean?
Habtamu Reply
What is different between quantity demand and demand?
Shukri Reply
Quantity demanded refers to the specific amount of a good or service that consumers are willing and able to purchase at a give price and within a specific time period. Demand, on the other hand, is a broader concept that encompasses the entire relationship between price and quantity demanded
Ezea
ok
Shukri
how do you save a country economic situation when it's falling apart
Lilia Reply
what is the difference between economic growth and development
Fiker Reply
Economic growth as an increase in the production and consumption of goods and services within an economy.but Economic development as a broader concept that encompasses not only economic growth but also social & human well being.
Shukri
production function means
Jabir
What do you think is more important to focus on when considering inequality ?
Abdisa Reply
any question about economics?
Awais Reply
sir...I just want to ask one question... Define the term contract curve? if you are free please help me to find this answer 🙏
Asui
it is a curve that we get after connecting the pareto optimal combinations of two consumers after their mutually beneficial trade offs
Awais
thank you so much 👍 sir
Asui
In economics, the contract curve refers to the set of points in an Edgeworth box diagram where both parties involved in a trade cannot be made better off without making one of them worse off. It represents the Pareto efficient allocations of goods between two individuals or entities, where neither p
Cornelius
In economics, the contract curve refers to the set of points in an Edgeworth box diagram where both parties involved in a trade cannot be made better off without making one of them worse off. It represents the Pareto efficient allocations of goods between two individuals or entities,
Cornelius
Suppose a consumer consuming two commodities X and Y has The following utility function u=X0.4 Y0.6. If the price of the X and Y are 2 and 3 respectively and income Constraint is birr 50. A,Calculate quantities of x and y which maximize utility. B,Calculate value of Lagrange multiplier. C,Calculate quantities of X and Y consumed with a given price. D,alculate optimum level of output .
Feyisa Reply
Answer
Feyisa
c
Jabir
the market for lemon has 10 potential consumers, each having an individual demand curve p=101-10Qi, where p is price in dollar's per cup and Qi is the number of cups demanded per week by the i th consumer.Find the market demand curve using algebra. Draw an individual demand curve and the market dema
Gsbwnw Reply
suppose the production function is given by ( L, K)=L¼K¾.assuming capital is fixed find APL and MPL. consider the following short run production function:Q=6L²-0.4L³ a) find the value of L that maximizes output b)find the value of L that maximizes marginal product
Abdureman
types of unemployment
Yomi Reply
What is the difference between perfect competition and monopolistic competition?
Mohammed
Got questions? Join the online conversation and get instant answers!
Jobilize.com Reply

Get Jobilize Job Search Mobile App in your pocket Now!

Get it on Google Play Download on the App Store Now


Source:  OpenStax, Nanomaterials and nanotechnology. OpenStax CNX. May 07, 2014 Download for free at http://legacy.cnx.org/content/col10700/1.13
Google Play and the Google Play logo are trademarks of Google Inc.

Notification Switch

Would you like to follow the 'Nanomaterials and nanotechnology' conversation and receive update notifications?

Ask