<< Chapter < Page Chapter >> Page >
A diagram of serial dilution. A large beaker on the left contains a dark solution. 1 ml is moved from this beaker to a tube containing 9 ml of broth. This tube has a dilution of 1:10 and is lighter in color than the original beaker. A sample of 0.1 ml from this tube is put on an agar plate; the colonies are too numerous to count. 1 ml is taken out of this tube and placed in a tube containing 9 ml of broth. This tube now has a dilution of 1:100 from the original beaker and is even lighter in color. 0.1 ml is plated on an a agar plate and the colonies are still too numerous to count. 1 ml is taken from this tube and placed in another tube containing 9 ml broth. This is now a dilution of 1:1000 from the original beaker and the tube is lighter than the last. 0.1 ml is taken out of this tube and placed on an agar plate; there are 389 colonies. 1 ml is taken out of this tube and placed in another tube containing 9 ml broth. This is now a dilution of 1:10,000 from the original beaker and this tube is even lighter than the last. 0.1 ml is taken out of this tube and placed on an agar plate; there are 50 colonies. 1 ml is taken out of this tube and placed in a tube containing 9 ml of broth. This is a dilution of 1:100,000 from the original beaker and this is the lightest tube of all. 0.1 ml is taken from this tube and placed on an agar plate; there are 2 colonies.
Serial dilution involves diluting a fixed volume of cells mixed with dilution solution using the previous dilution as an inoculum. The result is dilution of the original culture by an exponentially growing factor. (credit: modification of work by “Leberechtc”/Wikimedia Commons)

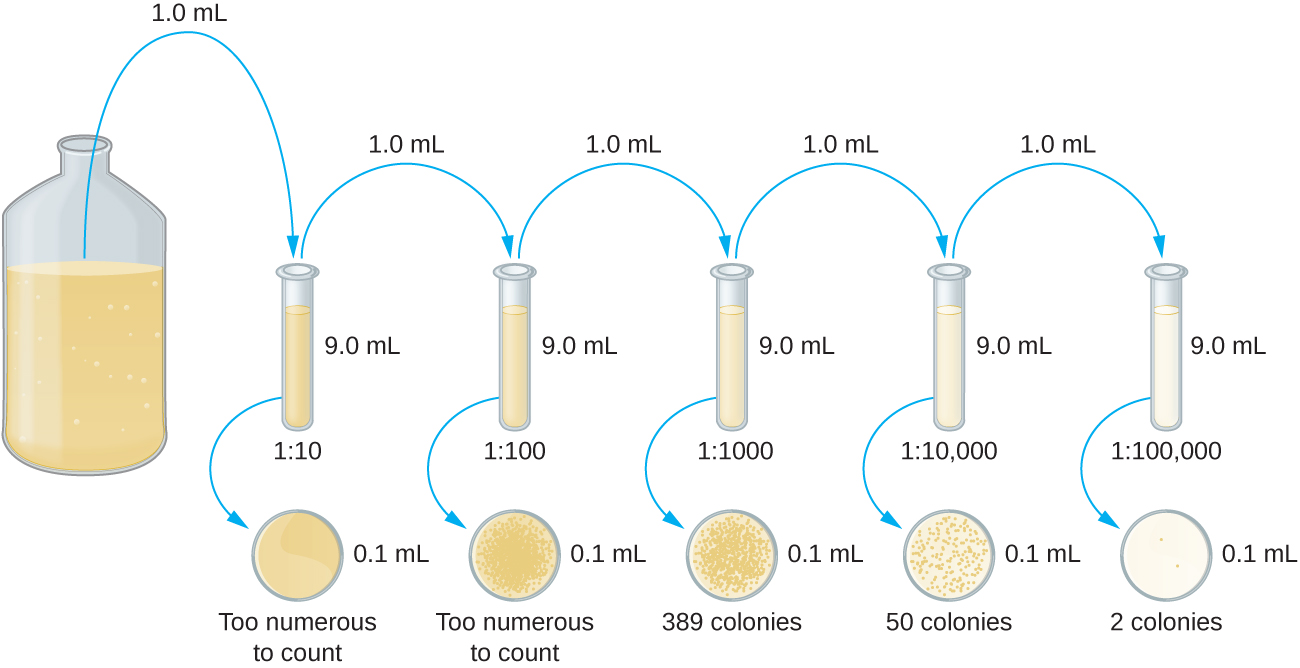
The dilution factor is used to calculate the number of cells in the original cell culture. In our example, an average of 50 colonies was counted on the plates obtained from the 1:10,000 dilution. Because only 0.1 mL of suspension was pipetted on the plate, the multiplier required to reconstitute the original concentration is 10 × 10,000. The number of CFU per mL is equal to 50 × 100 × 10,000 = 5,000,000. The number of bacteria in the culture is estimated as 5 million cells/mL. The colony count obtained from the 1:1000 dilution was 389, well below the expected 500 for a 10-fold difference in dilutions. This highlights the issue of inaccuracy when colony counts are greater than 300 and more than one bacterial cell grows into a single colony.

A diagram of the pour plate method. Step 1 – the bacterial sample is mixed with warm agar (45-50° C). Step 2 – the sample is poured onto a sterile plate. Step 3 – the sample is swirled to mix and allowed to solidify. Step 4 – the plate is incubated until bacterial colonies grow.
In the pour plate method of cell counting, the sample is mixed in liquid warm agar (45–50 °C) poured into a sterile Petri dish and further mixed by swirling. This process is repeated for each serial dilution prepared. The resulting colonies are counted and provide an estimate of the number of cells in the original volume sampled.
A diagram of the spread plate method. Step 1 – a sample (0.1 ml) from a bacterial dilution is poured onto a solid medium. Step 2 – the sample is spread evenly over the surface. Step 3 – the plate is incubated until bacterial colonies grow on the surface of the medium.
In the spread plate method of cell counting, the sample is poured onto solid agar and then spread using a sterile spreader. This process is repeated for each serial dilution prepared. The resulting colonies are counted and provide an estimate of the number of cells in the original volume samples.

A very dilute sample—drinking water, for example—may not contain enough organisms to use either of the plate count methods described. In such cases, the original sample must be concentrated rather than diluted before plating. This can be accomplished using a modification of the plate count technique called the membrane filtration technique . Known volumes are vacuum-filtered aseptically through a membrane with a pore size small enough to trap microorganisms. The membrane is transferred to a Petri plate containing an appropriate growth medium. Colonies are counted after incubation. Calculation of the cell density is made by dividing the cell count by the volume of filtered liquid.

The most probable number

The number of microorganisms in dilute samples is usually too low to be detected by the plate count methods described thus far. For these specimens, microbiologists routinely use the most probable number (MPN) method , a statistical procedure for estimating of the number of viable microorganisms in a sample. Often used for water and food samples, the MPN method evaluates detectable growth by observing changes in turbidity or color due to metabolic activity.

Questions & Answers

What are the factors that affect demand for a commodity
Florence Reply
differentiate between demand and supply giving examples
Lambiv Reply
differentiated between demand and supply using examples
Lambiv
what is labour ?
Lambiv
how will I do?
Venny Reply
how is the graph works?I don't fully understand
Rezat Reply
information
Eliyee
devaluation
Eliyee
t
WARKISA
hi guys good evening to all
Lambiv
multiple choice question
Aster Reply
appreciation
Eliyee
explain perfect market
Lindiwe Reply
In economics, a perfect market refers to a theoretical construct where all participants have perfect information, goods are homogenous, there are no barriers to entry or exit, and prices are determined solely by supply and demand. It's an idealized model used for analysis,
Ezea
What is ceteris paribus?
Shukri Reply
other things being equal
AI-Robot
When MP₁ becomes negative, TP start to decline. Extuples Suppose that the short-run production function of certain cut-flower firm is given by: Q=4KL-0.6K2 - 0.112 • Where is quantity of cut flower produced, I is labour input and K is fixed capital input (K-5). Determine the average product of lab
Kelo
Extuples Suppose that the short-run production function of certain cut-flower firm is given by: Q=4KL-0.6K2 - 0.112 • Where is quantity of cut flower produced, I is labour input and K is fixed capital input (K-5). Determine the average product of labour (APL) and marginal product of labour (MPL)
Kelo
yes,thank you
Shukri
Can I ask you other question?
Shukri
what is monopoly mean?
Habtamu Reply
What is different between quantity demand and demand?
Shukri Reply
Quantity demanded refers to the specific amount of a good or service that consumers are willing and able to purchase at a give price and within a specific time period. Demand, on the other hand, is a broader concept that encompasses the entire relationship between price and quantity demanded
Ezea
ok
Shukri
how do you save a country economic situation when it's falling apart
Lilia Reply
what is the difference between economic growth and development
Fiker Reply
Economic growth as an increase in the production and consumption of goods and services within an economy.but Economic development as a broader concept that encompasses not only economic growth but also social & human well being.
Shukri
production function means
Jabir
What do you think is more important to focus on when considering inequality ?
Abdisa Reply
any question about economics?
Awais Reply
sir...I just want to ask one question... Define the term contract curve? if you are free please help me to find this answer 🙏
Asui
it is a curve that we get after connecting the pareto optimal combinations of two consumers after their mutually beneficial trade offs
Awais
thank you so much 👍 sir
Asui
In economics, the contract curve refers to the set of points in an Edgeworth box diagram where both parties involved in a trade cannot be made better off without making one of them worse off. It represents the Pareto efficient allocations of goods between two individuals or entities, where neither p
Cornelius
In economics, the contract curve refers to the set of points in an Edgeworth box diagram where both parties involved in a trade cannot be made better off without making one of them worse off. It represents the Pareto efficient allocations of goods between two individuals or entities,
Cornelius
Suppose a consumer consuming two commodities X and Y has The following utility function u=X0.4 Y0.6. If the price of the X and Y are 2 and 3 respectively and income Constraint is birr 50. A,Calculate quantities of x and y which maximize utility. B,Calculate value of Lagrange multiplier. C,Calculate quantities of X and Y consumed with a given price. D,alculate optimum level of output .
Feyisa Reply
Answer
Feyisa
c
Jabir
the market for lemon has 10 potential consumers, each having an individual demand curve p=101-10Qi, where p is price in dollar's per cup and Qi is the number of cups demanded per week by the i th consumer.Find the market demand curve using algebra. Draw an individual demand curve and the market dema
Gsbwnw Reply
suppose the production function is given by ( L, K)=L¼K¾.assuming capital is fixed find APL and MPL. consider the following short run production function:Q=6L²-0.4L³ a) find the value of L that maximizes output b)find the value of L that maximizes marginal product
Abdureman
Got questions? Join the online conversation and get instant answers!
Jobilize.com Reply

Get Jobilize Job Search Mobile App in your pocket Now!

Get it on Google Play Download on the App Store Now


Source:  OpenStax, Microbiology. OpenStax CNX. Nov 01, 2016 Download for free at http://cnx.org/content/col12087/1.4
Google Play and the Google Play logo are trademarks of Google Inc.

Notification Switch

Would you like to follow the 'Microbiology' conversation and receive update notifications?

Ask