<< Chapter < Page Chapter >> Page >

One measure of business confidence is published by the OECD: the "business tendency surveys". Business opinion survey data are collected for 21 countries on future selling prices and employment, among other elements of the business climate. After sharply declining during the Great Recession, the measure has risen above zero again and is back to long-term averages (the indicator dips below zero when business outlook is weaker than usual). Of course, either of these survey measures is not very precise. They can however, suggest when confidence is rising or falling, as well as when it is relatively high or low compared to the past.

Because a rise in confidence is associated with higher consumption and investment demand, it will lead to an outward shift in the AD curve, and a move of the equilibrium, from E 0 to E 1 , to a higher quantity of output and a higher price level, as shown in [link] (a).

Consumer and business confidence often reflect macroeconomic realities; for example, confidence is usually high when the economy is growing briskly and low during a recession. However, economic confidence can sometimes rise or fall for reasons that do not have a close connection to the immediate economy, like a risk of war, election results, foreign policy events, or a pessimistic prediction about the future by a prominent public figure. U.S. presidents, for example, must be careful in their public pronouncements about the economy. If they offer economic pessimism, they risk provoking a decline in confidence that reduces consumption and investment and shifts AD to the left, and in a self-fulfilling prophecy, contributes to causing the recession that the president warned against in the first place. A shift of AD to the left, and the corresponding movement of the equilibrium, from E 0 to E 1 , to a lower quantity of output and a lower price level, is shown in [link] (b).

Shifts in aggregate demand

The two graphs show how aggregate demand shifts. The graph on the left shows aggregate demand shifting to the right toward the vertical potential GDP line. The graph on the right shows aggregate demand shifting to the left away from the vertical GDP line.
(a) An increase in consumer confidence or business confidence can shift AD to the right, from AD 0 to AD 1 . When AD shifts to the right, the new equilibrium (E 1 ) will have a higher quantity of output and also a higher price level compared with the original equilibrium (E 0 ). In this example, the new equilibrium (E 1 ) is also closer to potential GDP. An increase in government spending or a cut in taxes that leads to a rise in consumer spending can also shift AD to the right. (b) A decrease in consumer confidence or business confidence can shift AD to the left, from AD 0 to AD 1 . When AD shifts to the left, the new equilibrium (E 1 ) will have a lower quantity of output and also a lower price level compared with the original equilibrium (E 0 ). In this example, the new equilibrium (E 1 ) is also farther below potential GDP. A decrease in government spending or higher taxes that leads to a fall in consumer spending can also shift AD to the left.

How government macroeconomic policy choices can shift ad

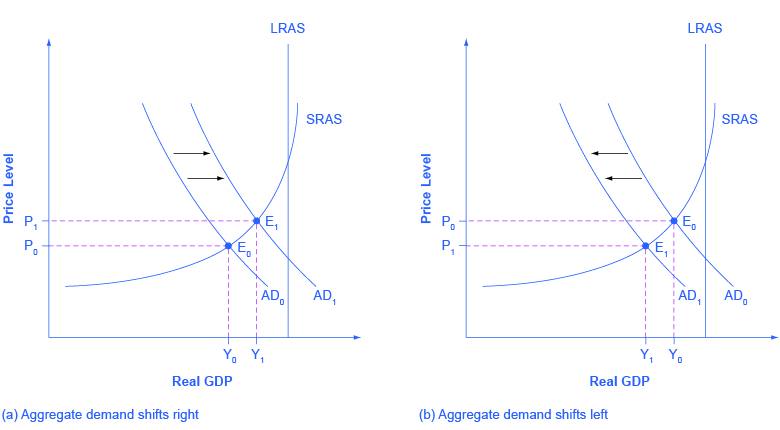
Government spending is one component of AD. Thus, higher government spending will cause AD to shift to the right, as in [link] (a), while lower government spending will cause AD to shift to the left, as in [link] (b). For example, in the United States, government spending declined by 3.2% of GDP during the 1990s, from 21% of GDP in 1991, and to 17.8% of GDP in 1998. However, from 2005 to 2009, the peak of the Great Recession, government spending increased from 19% of GDP to 21.4% of GDP. If changes of a few percentage points of GDP seem small to you, remember that since GDP was about $14.4 trillion in 2009, a seemingly small change of 2% of GDP is equal to close to $300 billion.

Questions & Answers

how do you get the 2/50
Abba Reply
number of sport play by 50 student construct discrete data
Aminu Reply
width of the frangebany leaves on how to write a introduction
Theresa Reply
Solve the mean of variance
Veronica Reply
Step 1: Find the mean. To find the mean, add up all the scores, then divide them by the number of scores. ... Step 2: Find each score's deviation from the mean. ... Step 3: Square each deviation from the mean. ... Step 4: Find the sum of squares. ... Step 5: Divide the sum of squares by n – 1 or N.
kenneth
what is error
Yakuba Reply
Is mistake done to something
Vutshila
Hy
anas
hy
What is the life teble
anas
hy
Jibrin
statistics is the analyzing of data
Tajudeen Reply
what is statics?
Zelalem Reply
how do you calculate mean
Gloria Reply
diveving the sum if all values
Shaynaynay
let A1,A2 and A3 events be independent,show that (A1)^c, (A2)^c and (A3)^c are independent?
Fisaye Reply
what is statistics
Akhisani Reply
data collected all over the world
Shaynaynay
construct a less than and more than table
Imad Reply
The sample of 16 students is taken. The average age in the sample was 22 years with astandard deviation of 6 years. Construct a 95% confidence interval for the age of the population.
Aschalew Reply
Bhartdarshan' is an internet-based travel agency wherein customer can see videos of the cities they plant to visit. The number of hits daily is a normally distributed random variable with a mean of 10,000 and a standard deviation of 2,400 a. what is the probability of getting more than 12,000 hits? b. what is the probability of getting fewer than 9,000 hits?
Akshay Reply
Bhartdarshan'is an internet-based travel agency wherein customer can see videos of the cities they plan to visit. The number of hits daily is a normally distributed random variable with a mean of 10,000 and a standard deviation of 2,400. a. What is the probability of getting more than 12,000 hits
Akshay
1
Bright
Sorry i want to learn more about this question
Bright
Someone help
Bright
a= 0.20233 b=0.3384
Sufiyan
a
Shaynaynay
How do I interpret level of significance?
Mohd Reply
It depends on your business problem or in Machine Learning you could use ROC- AUC cruve to decide the threshold value
Shivam
how skewness and kurtosis are used in statistics
Owen Reply
yes what is it
Taneeya
Got questions? Join the online conversation and get instant answers!
Jobilize.com Reply

Get Jobilize Job Search Mobile App in your pocket Now!

Get it on Google Play Download on the App Store Now


Source:  OpenStax, Macroeconomics. OpenStax CNX. Jun 16, 2014 Download for free at http://legacy.cnx.org/content/col11626/1.10
Google Play and the Google Play logo are trademarks of Google Inc.

Notification Switch

Would you like to follow the 'Macroeconomics' conversation and receive update notifications?

Ask