<< Chapter < Page Chapter >> Page >

All of these choices are theoretically possible, depending on Kimberly’s personal preferences as expressed through the total and marginal utility she would receive from consuming these two goods. When income rises, the most common reaction is to purchase more of both goods, like choice N, which is to the upper right relative to Kimberly’s original choice M, although exactly how much more of each good will vary according to personal taste. Conversely, when income falls, the most typical reaction is to purchase less of both goods. As defined in the chapter on Demand and Supply and again in the chapter on Elasticity , goods and services are called normal goods when a rise in income leads to a rise in the quantity consumed of that good and a fall in income leads to a fall in quantity consumed.

However, depending on Kimberly’s preferences, a rise in income could cause consumption of one good to increase while consumption of the other good declines. A choice like P means that a rise in income caused her quantity consumed of overnight stays to decline, while a choice like Q would mean that a rise in income caused her quantity of concerts to decline. Goods where demand declines as income rises (or conversely, where the demand rises as income falls) are called “inferior goods.” An inferior good    occurs when people trim back on a good as income rises, because they can now afford the more expensive choices that they prefer. For example, a higher-income household might eat fewer hamburgers or be less likely to buy a used car, and instead eat more steak and buy a new car.

How price changes affect consumer choices

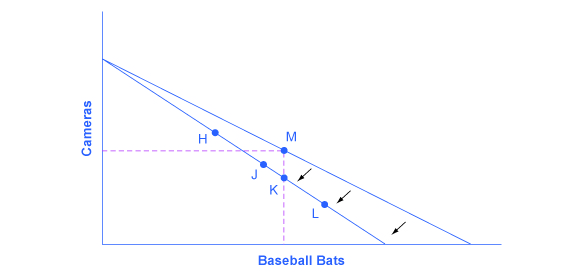
For analyzing the possible effect of a change in price on consumption, let’s again use a concrete example. [link] represents the consumer choice of Sergei, who chooses between purchasing baseball bats and cameras. A price increase for baseball bats would have no effect on the ability to purchase cameras, but it would reduce the number of bats Sergei could afford to buy. Thus a price increase for baseball bats, the good on the horizontal axis, causes the budget constraint to rotate inward, as if on a hinge, from the vertical axis. As in the previous section, the point labeled M represents the originally preferred point on the original budget constraint, which Sergei has chosen after contemplating his total utility and marginal utility and the tradeoffs involved along the budget constraint. In this example, the units along the horizontal and vertical axes are not numbered, so the discussion must focus on whether more or less of certain goods will be consumed, not on numerical amounts.

How a change in price affects consumption choices

The graph shows how price changes influence spending choices.
The original utility-maximizing choice is M. When the price rises, the budget constraint shifts in to the left. The dashed lines make it possible to see at a glance whether the new consumption choice involves less of both goods, or less of one good and more of the other. The new possible choices would be fewer baseball bats and more cameras, like point H, or less of both goods, as at point J. Choice K would mean that the higher price of bats led to exactly the same quantity of bats being consumed, but fewer cameras. Choices like L are ruled out as theoretically possible but highly unlikely in the real world, because they would mean that a higher price for baseball bats means a greater quantity consumed of baseball bats.

Questions & Answers

how do you get the 2/50
Abba Reply
number of sport play by 50 student construct discrete data
Aminu Reply
width of the frangebany leaves on how to write a introduction
Theresa Reply
Solve the mean of variance
Veronica Reply
Step 1: Find the mean. To find the mean, add up all the scores, then divide them by the number of scores. ... Step 2: Find each score's deviation from the mean. ... Step 3: Square each deviation from the mean. ... Step 4: Find the sum of squares. ... Step 5: Divide the sum of squares by n – 1 or N.
kenneth
what is error
Yakuba Reply
Is mistake done to something
Vutshila
Hy
anas
hy
What is the life teble
anas
hy
Jibrin
statistics is the analyzing of data
Tajudeen Reply
what is statics?
Zelalem Reply
how do you calculate mean
Gloria Reply
diveving the sum if all values
Shaynaynay
let A1,A2 and A3 events be independent,show that (A1)^c, (A2)^c and (A3)^c are independent?
Fisaye Reply
what is statistics
Akhisani Reply
data collected all over the world
Shaynaynay
construct a less than and more than table
Imad Reply
The sample of 16 students is taken. The average age in the sample was 22 years with astandard deviation of 6 years. Construct a 95% confidence interval for the age of the population.
Aschalew Reply
Bhartdarshan' is an internet-based travel agency wherein customer can see videos of the cities they plant to visit. The number of hits daily is a normally distributed random variable with a mean of 10,000 and a standard deviation of 2,400 a. what is the probability of getting more than 12,000 hits? b. what is the probability of getting fewer than 9,000 hits?
Akshay Reply
Bhartdarshan'is an internet-based travel agency wherein customer can see videos of the cities they plan to visit. The number of hits daily is a normally distributed random variable with a mean of 10,000 and a standard deviation of 2,400. a. What is the probability of getting more than 12,000 hits
Akshay
1
Bright
Sorry i want to learn more about this question
Bright
Someone help
Bright
a= 0.20233 b=0.3384
Sufiyan
a
Shaynaynay
How do I interpret level of significance?
Mohd Reply
It depends on your business problem or in Machine Learning you could use ROC- AUC cruve to decide the threshold value
Shivam
how skewness and kurtosis are used in statistics
Owen Reply
yes what is it
Taneeya
Got questions? Join the online conversation and get instant answers!
Jobilize.com Reply

Get Jobilize Job Search Mobile App in your pocket Now!

Get it on Google Play Download on the App Store Now


Source:  OpenStax, Principles of economics. OpenStax CNX. Sep 19, 2014 Download for free at http://legacy.cnx.org/content/col11613/1.11
Google Play and the Google Play logo are trademarks of Google Inc.

Notification Switch

Would you like to follow the 'Principles of economics' conversation and receive update notifications?

Ask