<< Chapter < Page Chapter >> Page >

The pathways of monetary policy

This image is a chart showing the mechanisms through which monetary policy affects output.
(a) In expansionary monetary policy the central bank causes the supply of money and loanable funds to increase, which lowers the interest rate, stimulating additional borrowing for investment and consumption, and shifting aggregate demand right. The result is a higher price level and, at least in the short run, higher real GDP. (b) In contractionary monetary policy, the central bank causes the supply of money and credit in the economy to decrease, which raises the interest rate, discouraging borrowing for investment and consumption, and shifting aggregate demand left. The result is a lower price level and, at least in the short run, lower real GDP.

Federal reserve actions over last four decades

For the period from the mid-1970s up through the end of 2007, Federal Reserve monetary policy can largely be summed up by looking at how it targeted the federal funds interest rate using open market operations.

Of course, telling the story of the U.S. economy since 1975 in terms of Federal Reserve actions leaves out many other macroeconomic factors that were influencing unemployment, recession, economic growth, and inflation over this time. The nine episodes of Federal Reserve action outlined in the sections below also demonstrate that the central bank should be considered one of the leading actors influencing the macro economy. As noted earlier, the single person with the greatest power to influence the U.S. economy is probably the chairperson of the Federal Reserve.

[link] shows how the Federal Reserve has carried out monetary policy by targeting the federal funds interest rate in the last few decades. The graph shows the federal funds interest rate (remember, this interest rate is set through open market operations), the unemployment rate    , and the inflation rate since 1975. Different episodes of monetary policy during this period are indicated in the figure.
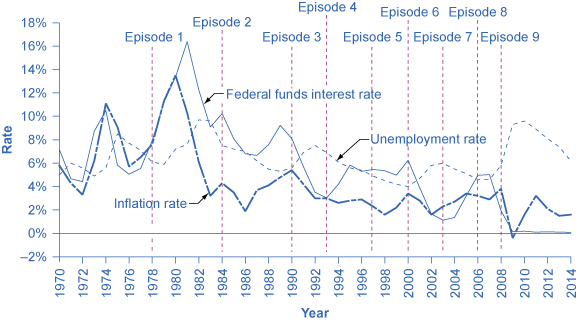
Monetary policy, unemployment, and inflation

This graph shows the historical rate of inflation, unemployment and the federal funds interest rate during periods of recession.
Through the episodes shown here, the Federal Reserve typically reacted to higher inflation with a contractionary monetary policy and a higher interest rate, and reacted to higher unemployment with an expansionary monetary policy and a lower interest rate.

Episode 1

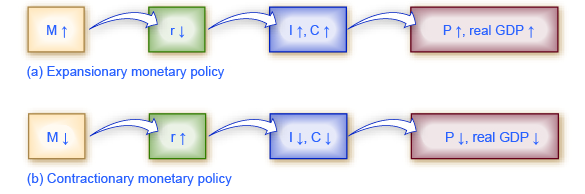
Consider Episode 1 in the late 1970s. The rate of inflation was very high, exceeding 10% in 1979 and 1980, so the Federal Reserve used tight monetary policy to raise interest rates, with the federal funds rate rising from 5.5% in 1977 to 16.4% in 1981. By 1983, inflation was down to 3.2%, but aggregate demand contracted sharply enough that back-to-back recessions occurred in 1980 and in 1981–1982, and the unemployment rate rose from 5.8% in 1979 to 9.7% in 1982.

Episode 2

In Episode 2, when the Federal Reserve was persuaded in the early 1980s that inflation was declining, the Fed began slashing interest rates to reduce unemployment. The federal funds interest rate fell from 16.4% in 1981 to 6.8% in 1986. By 1986 or so, inflation had fallen to about 2% and the unemployment rate had come down to 7%, and was still falling.

Questions & Answers

Ayele, K., 2003. Introductory Economics, 3rd ed., Addis Ababa.
Widad Reply
can you send the book attached ?
Ariel
?
Ariel
What is economics
Widad Reply
the study of how humans make choices under conditions of scarcity
AI-Robot
U(x,y) = (x×y)1/2 find mu of x for y
Desalegn Reply
U(x,y) = (x×y)1/2 find mu of x for y
Desalegn
what is ecnomics
Jan Reply
this is the study of how the society manages it's scarce resources
Belonwu
what is macroeconomic
John Reply
macroeconomic is the branch of economics which studies actions, scale, activities and behaviour of the aggregate economy as a whole.
husaini
etc
husaini
difference between firm and industry
husaini Reply
what's the difference between a firm and an industry
Abdul
firm is the unit which transform inputs to output where as industry contain combination of firms with similar production 😅😅
Abdulraufu
Suppose the demand function that a firm faces shifted from Qd  120 3P to Qd  90  3P and the supply function has shifted from QS  20  2P to QS 10  2P . a) Find the effect of this change on price and quantity. b) Which of the changes in demand and supply is higher?
Toofiq Reply
explain standard reason why economic is a science
innocent Reply
factors influencing supply
Petrus Reply
what is economic.
Milan Reply
scares means__________________ends resources. unlimited
Jan
economics is a science that studies human behaviour as a relationship b/w ends and scares means which have alternative uses
Jan
calculate the profit maximizing for demand and supply
Zarshad Reply
Why qualify 28 supplies
Milan
what are explicit costs
Nomsa Reply
out-of-pocket costs for a firm, for example, payments for wages and salaries, rent, or materials
AI-Robot
concepts of supply in microeconomics
David Reply
economic overview notes
Amahle Reply
identify a demand and a supply curve
Salome Reply
i don't know
Parul
there's a difference
Aryan
Demand curve shows that how supply and others conditions affect on demand of a particular thing and what percent demand increase whith increase of supply of goods
Israr
Hi Sir please how do u calculate Cross elastic demand and income elastic demand?
Abari
Got questions? Join the online conversation and get instant answers!
Jobilize.com Reply

Get Jobilize Job Search Mobile App in your pocket Now!

Get it on Google Play Download on the App Store Now


Source:  OpenStax, Principles of economics. OpenStax CNX. Sep 19, 2014 Download for free at http://legacy.cnx.org/content/col11613/1.11
Google Play and the Google Play logo are trademarks of Google Inc.

Notification Switch

Would you like to follow the 'Principles of economics' conversation and receive update notifications?

Ask