

| << Chapter < Page | Chapter >> Page > |
These are two ways of writing the domain and range of a function, set notation and interval notation . Both notations are used in mathematics, so you should be familiar with each.
A set of certain values has the following form:
We read this notation as “the set of all values where all the conditions are satisfied”. For example, the set of all positive real numbers can be written as which reads as “the set of all values where is a real number and is greater than zero”.
Here we write an interval in the form ' lower bracket, lower number, comma, upper number, upper bracket '. We can use two types of brackets, square ones or round ones . A square bracket means including the number at the end of the interval whereas a round bracket means excluding the number at the end of the interval. It is important to note that this notation can only be used for all real numbers in an interval. It cannot be used to describe integers in an interval or rational numbers in an interval.
So if is a real number greater than 2 and less than or equal to 8, then is any number in the interval
It is obvious that 2 is the lower number and 8 the upper number. The round bracket means 'excluding 2', since is greater than 2, and the square bracket means 'including 8' as is less than or equal to 8.
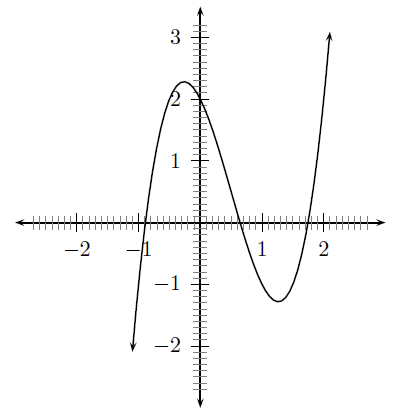
The intercept is the point at which a graph intersects an axis. The -intercepts are the points at which the graph cuts the -axis and the -intercepts are the points at which the graph cuts the -axis.
In [link] (a), the A is the -intercept and B, C and F are -intercepts.
You will usually need to calculate the intercepts. The two most important things to remember is that at the -intercept, and at the -intercept, .
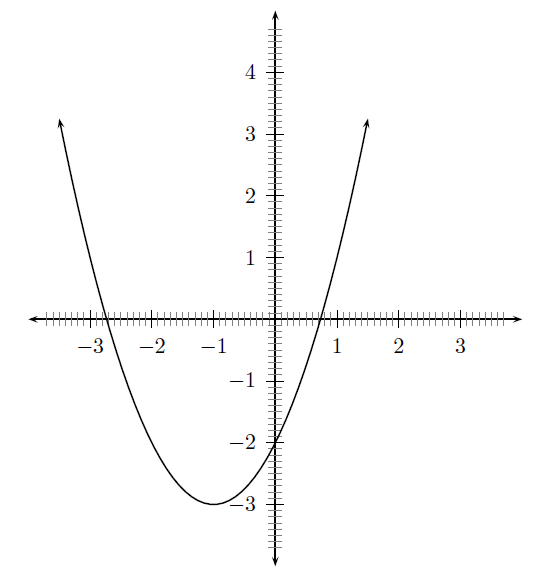
For example, calculate the intercepts of . For the -intercept, . Therefore the -intercept is . For the -intercept, . Therefore the -intercept is found from , giving .
Turning points only occur for graphs of functions whose highest power is greater than 1. For example, graphs of the following functions will have turning points.
There are two types of turning points: a minimal turning point and a maximal turning point. A minimal turning point is a point on the graph where the graph stops decreasing in value and starts increasing in value and a maximal turning point is a point on the graph where the graph stops increasing in value and starts decreasing. These are shown in [link] .
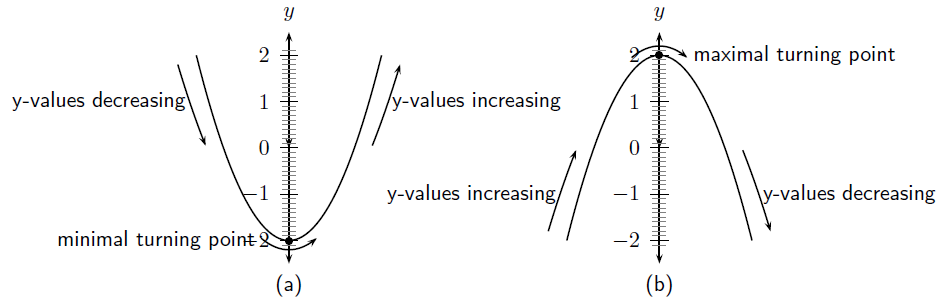
In [link] (a), E is a maximal turning point and D is a minimal turning point.
An asymptote is a straight or curved line, which the graph of a function will approach, but never touch.
In [link] (b), the -axis and line are both asymptotes as the graph approaches both these lines, but never touches them.
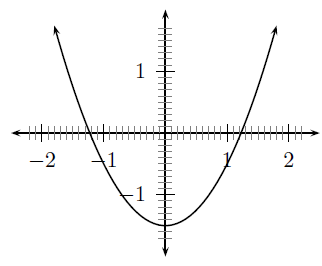
Graphs look the same on either side of lines of symmetry. These lines may include the - and - axes. For example, in [link] is symmetric about the -axis. This is described as the axis of symmetry. Not every graph will have a line of symmetry.
In the discussion of turning points, we saw that the graph of a function can start or stop increasing or decreasing at a turning point. If the graph in [link] (a) is examined, we find that the values of the graph increase and decrease over different intervals. We see that the graph increases (i.e. that the -values increase) from - to point E, then it decreases (i.e. the -values decrease) from point E to point D and then it increases from point D to + .
A graph is said to be continuous if there are no breaks in the graph. For example, the graph in [link] (a) can be described as a continuous graph, while the graph in [link] (b) has a break around the asymptotes which means that it is not continuous. In [link] (b), it is clear that the graph does have a break in it around the asymptote.
Notification Switch
Would you like to follow the 'Siyavula textbooks: grade 10 maths [caps]' conversation and receive update notifications?

|
|

|
|

|
|

|
|

|
|

|
|

|
|

|
|

|
|

|