

| << Chapter < Page | Chapter >> Page > |
For example, assume that a photographic image includes a picture of a vase. Assume that the original image is cropped twice along two different bordersproducing two new images. Assume that both of the new images contain the picture of the vase, but in different locations. That vase will contribute the samevalues to the amplitude spectra of the two images regardless of the location of the vase in each of the images. This knowledge will be useful to us in futuremodules when we begin using 2D Fourier transforms to process photographic images.
If you compare Figure 8 with Figure 7 , you will see that the amplitude spectrum is the same for both surfaces despite the fact that the box is in adifferent location in each of the two surfaces. However, the real and imaginary parts of the spectrum in Figure 8 are considerably different from the real and imaginary parts of the spectrum in Figure 7 .
The code that was used to create the surface for this case is straightforward. You can view that code in Listing 22 near the end of the module.
This case draws a short line containing eight points along the diagonal from top-left to lower right in the space domain. You can view this surface in thetop-left image in Figure 9 . You can view the code that generated this surface in Listing 22 near the end of the module.
| Figure 9. Graphic output for Case 4. |
|---|
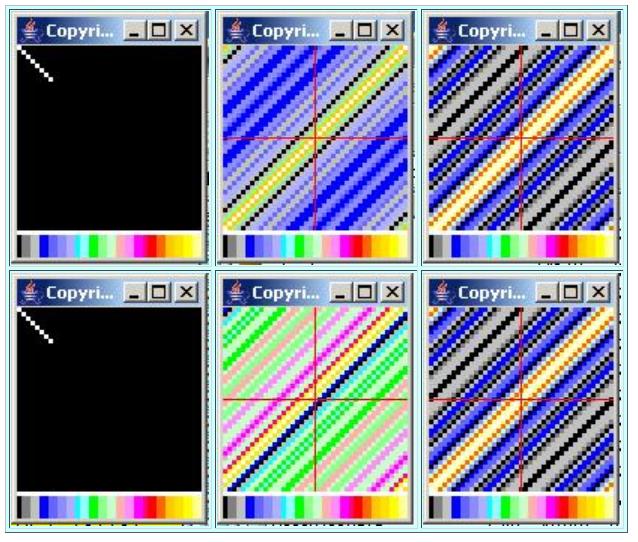 |
On the basis of prior experience, we would expect the wavenumber amplitude spectrum, (when viewed along any line in wavenumber space parallel to the line in space) , to have a rectified sin(x)/x shape. We would expect the peak of that shape to be centered on the origin in wavenumber space. We wouldexpect the width of the peak in wavenumber space to be inversely proportional to the length of the line in space.
We would expect the amplitude spectrum when viewed along any line in wavenumber space perpendicular to the line in space to have a constant value.
The shape of the amplitude spectrum shown in the lower right image in Figure 9 agrees with our expectations. Although not shown here, if we were to make theline of points longer, the width of the peak in the rectified sin(x)/x would become narrower. If we were to make the line of points shorter, the peak wouldbecome wider, as we will demonstrate in Case 5.
Our expectations regarding symmetry and asymmetry for the real and imaginary parts shown in the center images of Figure 9 are borne out. The real part is at the top center and the imaginary part is at the bottom center.
The output from the inverse Fourier transform shown in the bottom left of Figure 9 matches the original space domain surface in the top left of Figure 9 .
This case draws a short line consisting of only four points perpendicular to the diagonal from top-left to lower right. This line of points is perpendicularto the direction of the line of points in Case 4.
You can view the surface for this case in the top-left image of Figure 10 . You can view the code that generated this surface in Listing 22 near the end of the module.
Notification Switch
Would you like to follow the 'Digital signal processing - dsp' conversation and receive update notifications?
|
|

|
|
|
|

|
|

|
|

|
|
|
|
|

|
|

|
|
|
|