<< Chapter < Page Chapter >> Page >

Natuurwetenskappe

Graad 8

Materie: klassifikasie

Module 22

Skeiding van mengsels

  • Afhangend van die tipe mengsel kan verskillende metodes van skeiding toegepas word.

Die onderwyser gaan die volgende METODES verduideliken moontlik demonstreer:
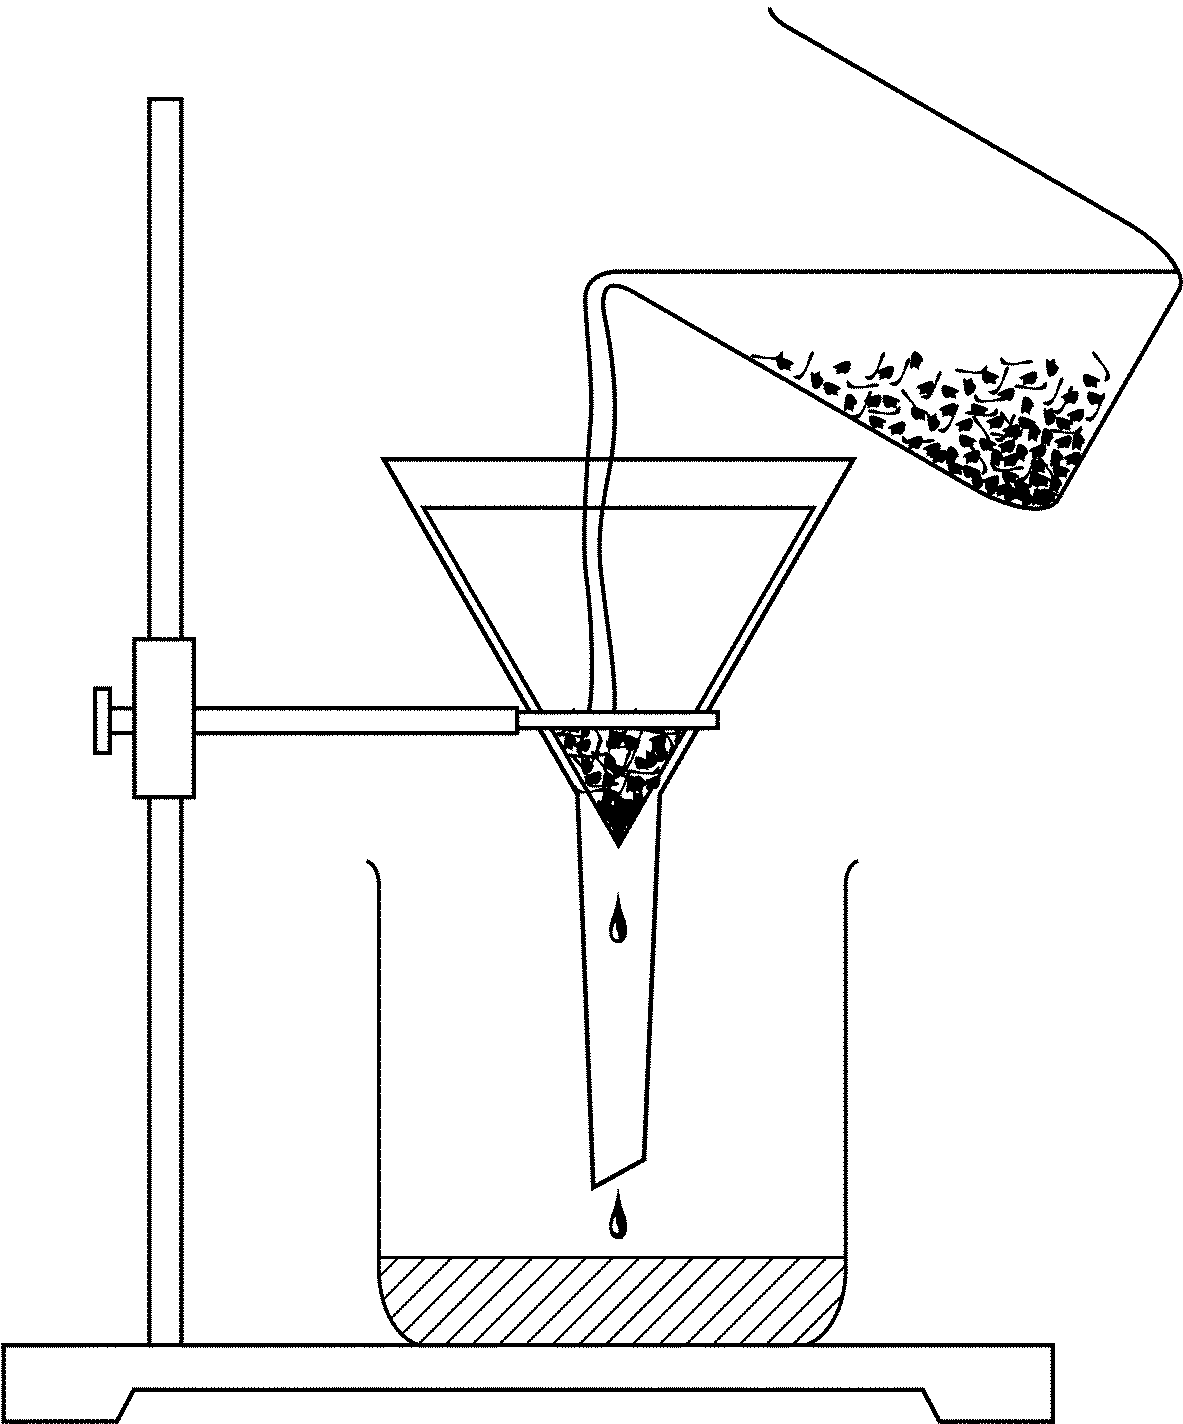
  • Handsortering – sorteer t.o.v. groottes, vorm en kleure
  • Filtrasie – een van stowwe is oplosbaar; indamping
  • Verdamping – los op in water en damp in
  • Skeitregter – twee vloeistowwe met verskillende digthede
  • Distillasie – gebruik 'n kondensor en distilleerfles; verhit en verdamp en kondenseer

APPARAAT:

Skets van filtreer- en distilleerapparaat, asook skeitregter.

Aktiwiteit: kies skeidingsmetode

MENGSEL METODE
Sand en sout
Boontjie en grondboontjies
Koeldrankstroop en water
Olie en water
Verskillende muntstukke

Opdrag

Verduidelik stapsgewys met behulp van sketse hoe jy te werk sal gaan om:

a) sand en sout te skei;

b) koeldrankstroop en water te skei.

1. Watter metode sou jy gebruik om varswater uit seewater te kry?

2. Hoekom maak die mens nie van die metode gebruik om varswaterbronne aan te vul nie?

3. Wat is die verskil tussen 'n distillaat en 'n filtraat?

4. Wat is fraksionele distillasie en noem twee bedrywe waar dit gebruik word.

Projek

Hoe sou jy water en alkohol skei?

  • Vind ook meer uit oor fraksionele distillasie .
  • Wenk: gebruik die kookpunte waaroor jy vroeër meer moes uitvind (leereenheid 3).
  • Sketse is belangrik!
  • Handig projek in op datum deur onderwyser bepaal.

Assessering van projek

Kon jy die projek beplan (AS 1.1), data insamel (AS 1.2) en bevindinge evalueer en kommunikeer (AS 1.3), asook enige kennis toepas (AS 2.4)?

[LU 1.1; 1.2; 1.3; 2.4]

Assessering

LU 1

Wetenskaplike Ondersoek

Die leerder is in staat om met selfvertroue op weetgierigheid oor natuurlike verskynsels te reageer, en om binne die konteks van wetenskap, tegnologie en die omgewing verbande te ondersoek en probleme op te los.

Dit is bewys as die leerder:

1.1 ondersoeke kan beplan;

1.2 ondersoeke kan uitvoer en data kan insamel;

1.3 data kan evalueer en bevindinge kan kommunikeer.

LU 2

Wetenskaplike Kennis

Die leerder ken, interpreteer en pas wetenskaplike, tegnologiese en omgewingskennis toe.

Dit is bewys as die leerder:

2.1 sinvolle inligting kan onthou;

2.2 inligting in kategorieë kan plaas;

2.3 inligting kan interpreteer;

2.4 kennis kan toepas.

Memorandum

Skeiding van mengsels

AKTIWITEIT: Kies skeidingsmetode

MENGSEL METODE
Sand en sout Filtreer
Boontjie en grondboontjies Handsortering
Koeldrankstroop en water Distillasie
Olie en water Skeitregter
Verskillende muntstukke Handsortering
  • Sketse – regte apparaat

1. distillasie

2. koste

3. distillaat – vloeistof kondenseer na distillasie

filtraat – vloeistof wat filtreer

4. filtrasie deur verskillende kookpunte, bv. olieraffinering en spiritualieë- (alkohol) bedryf

PROJEK:

  • Alkohol kook by 79 °C – fraksionele distillasie verwyder alkohol; water bly agter
  • Regulering van temperatuur met termometer uiters belangrik

Skets van Liebiegkondensor-opstelling belangrik.

Questions & Answers

What is inflation
Bright Reply
a general and ongoing rise in the level of prices in an economy
AI-Robot
What are the factors that affect demand for a commodity
Florence Reply
differentiate between demand and supply giving examples
Lambiv Reply
differentiated between demand and supply using examples
Lambiv
what is labour ?
Lambiv
how will I do?
Venny Reply
how is the graph works?I don't fully understand
Rezat Reply
information
Eliyee
devaluation
Eliyee
t
WARKISA
hi guys good evening to all
Lambiv
multiple choice question
Aster Reply
appreciation
Eliyee
explain perfect market
Lindiwe Reply
In economics, a perfect market refers to a theoretical construct where all participants have perfect information, goods are homogenous, there are no barriers to entry or exit, and prices are determined solely by supply and demand. It's an idealized model used for analysis,
Ezea
What is ceteris paribus?
Shukri Reply
other things being equal
AI-Robot
When MP₁ becomes negative, TP start to decline. Extuples Suppose that the short-run production function of certain cut-flower firm is given by: Q=4KL-0.6K2 - 0.112 • Where is quantity of cut flower produced, I is labour input and K is fixed capital input (K-5). Determine the average product of lab
Kelo
Extuples Suppose that the short-run production function of certain cut-flower firm is given by: Q=4KL-0.6K2 - 0.112 • Where is quantity of cut flower produced, I is labour input and K is fixed capital input (K-5). Determine the average product of labour (APL) and marginal product of labour (MPL)
Kelo
yes,thank you
Shukri
Can I ask you other question?
Shukri
what is monopoly mean?
Habtamu Reply
What is different between quantity demand and demand?
Shukri Reply
Quantity demanded refers to the specific amount of a good or service that consumers are willing and able to purchase at a give price and within a specific time period. Demand, on the other hand, is a broader concept that encompasses the entire relationship between price and quantity demanded
Ezea
ok
Shukri
how do you save a country economic situation when it's falling apart
Lilia Reply
what is the difference between economic growth and development
Fiker Reply
Economic growth as an increase in the production and consumption of goods and services within an economy.but Economic development as a broader concept that encompasses not only economic growth but also social & human well being.
Shukri
production function means
Jabir
What do you think is more important to focus on when considering inequality ?
Abdisa Reply
any question about economics?
Awais Reply
sir...I just want to ask one question... Define the term contract curve? if you are free please help me to find this answer 🙏
Asui
it is a curve that we get after connecting the pareto optimal combinations of two consumers after their mutually beneficial trade offs
Awais
thank you so much 👍 sir
Asui
In economics, the contract curve refers to the set of points in an Edgeworth box diagram where both parties involved in a trade cannot be made better off without making one of them worse off. It represents the Pareto efficient allocations of goods between two individuals or entities, where neither p
Cornelius
In economics, the contract curve refers to the set of points in an Edgeworth box diagram where both parties involved in a trade cannot be made better off without making one of them worse off. It represents the Pareto efficient allocations of goods between two individuals or entities,
Cornelius
Suppose a consumer consuming two commodities X and Y has The following utility function u=X0.4 Y0.6. If the price of the X and Y are 2 and 3 respectively and income Constraint is birr 50. A,Calculate quantities of x and y which maximize utility. B,Calculate value of Lagrange multiplier. C,Calculate quantities of X and Y consumed with a given price. D,alculate optimum level of output .
Feyisa Reply
Answer
Feyisa
c
Jabir
Got questions? Join the online conversation and get instant answers!
Jobilize.com Reply

Get Jobilize Job Search Mobile App in your pocket Now!

Get it on Google Play Download on the App Store Now


Source:  OpenStax, Natuurwetenskappe graad 8. OpenStax CNX. Sep 12, 2009 Download for free at http://cnx.org/content/col11049/1.1
Google Play and the Google Play logo are trademarks of Google Inc.

Notification Switch

Would you like to follow the 'Natuurwetenskappe graad 8' conversation and receive update notifications?

Ask