

| << Chapter < Page | Chapter >> Page > |
We will achieve the desired array response by using an array having thirteen elements in the form of a cross with very specific weighting applied to eachelement prior to summation. The weighted array and the wavenumber response of the array are shown in Figure 5 .
| Figure 5. Wavenumber response of a two-dimensional array. |
|---|
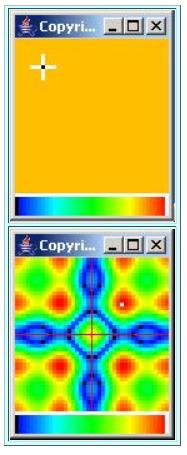 |
The wavenumber response of the array (shown at the bottom in Figure 5 ) was produced by performing a 2D Fourier transform on the weighted array (shown at the top in Figure 5 ) .
The center element in the array was weighted by -4.5 before summation. (The signal from this element was amplified by a factor of 4.5 and the sign of the signal was inverted prior to summation.)
The twelve remaining elements were weighted by a factor of 1.0 before summation.
Regardless of direction, the wavelength or wavenumber of the RF energy transmitted by a commercial radio station is the same and it doesn't change overtime, (unless the frequency on which the station broadcasts changes) .
Once again, we can determine the wavenumber response of the array for a given wavenumber from any direction by drawing a circle on the response plot, centeredat the origin, with the radius of the circle equal to the specific wavenumber of interest.
Assume that the wavenumber of interest in our case is exactly equal to the distance from the origin to the white spot in the upper right quadrant of thewavenumber response plot. This white spot represents the maximum response of the array.
(If our computation had perfect accuracy, there would be a white spot at the same location in all four quadrants.)
Draw a circle centered on the origin having a radius that causes the circle to go through the white spot.
The color corresponding to the response at any point on the circle represents the response of the array to that wavenumber for waves arriving from thatdirection (or in the case of a transmitter, for waves being transmitted in that direction) .
The circle passes through yellow, red, and white (indicating a high response) in the general directions of northeast, southeast, southwest, and northwest. This means that a strong RF signal will be transmitted to the peopleliving along the highways in those four directions.
The circle passes through green, cyan, and blue (indicating a lower response) in the general directions of north, south, east, and west. This means that very little of the precious RF energy will be transmitted to thecotton plants and the cows that live in those directions.
Thus, an array of active transmitter elements arranged and weighted as shown at the top of Figure 5 might be a reasonable design solution for your radio station. (However, I suspect that an experienced RF engineer would have a much more sophisticated solution.)
In any event, you have now seen one possible practical example of the use of a 2D Fourier transform.
Notification Switch
Would you like to follow the 'Digital signal processing - dsp' conversation and receive update notifications?

|
|

|
|

|
|

|
|

|
|

|
|

|
|

|
|

|
|

|