<< Chapter < Page Chapter >> Page >
By the end of this section, you will be able to:
  • Identify the mathematical relationships between the various properties of gases
  • Use the ideal gas law, and related gas laws, to compute the values of various gas properties under specified conditions

During the seventeenth and especially eighteenth centuries, driven both by a desire to understand nature and a quest to make balloons in which they could fly ( [link] ), a number of scientists established the relationships between the macroscopic physical properties of gases, that is, pressure, volume, temperature, and amount of gas. Although their measurements were not precise by today’s standards, they were able to determine the mathematical relationships between pairs of these variables (e.g., pressure and temperature, pressure and volume) that hold for an ideal gas—a hypothetical construct that real gases approximate under certain conditions. Eventually, these individual laws were combined into a single equation—the ideal gas law —that relates gas quantities for gases and is quite accurate for low pressures and moderate temperatures. We will consider the key developments in individual relationships (for pedagogical reasons not quite in historical order), then put them together in the ideal gas law.

This figure includes three images. Image a is a black and white image of a hydrogen balloon apparently being deflated by a mob of people. In image b, a blue, gold, and red balloon is being held to the ground with ropes while positioned above a platform from which smoke is rising beneath the balloon. In c, an image is shown in grey on a peach-colored background of an inflated balloon with vertical striping in the air. It appears to have a basket attached to its lower side. A large stately building appears in the background.
In 1783, the first (a) hydrogen-filled balloon flight, (b) manned hot air balloon flight, and (c) manned hydrogen-filled balloon flight occurred. When the hydrogen-filled balloon depicted in (a) landed, the frightened villagers of Gonesse reportedly destroyed it with pitchforks and knives. The launch of the latter was reportedly viewed by 400,000 people in Paris.

Pressure and temperature: amontons’s law

Imagine filling a rigid container attached to a pressure gauge with gas and then sealing the container so that no gas may escape. If the container is cooled, the gas inside likewise gets colder and its pressure is observed to decrease. Since the container is rigid and tightly sealed, both the volume and number of moles of gas remain constant. If we heat the sphere, the gas inside gets hotter ( [link] ) and the pressure increases.
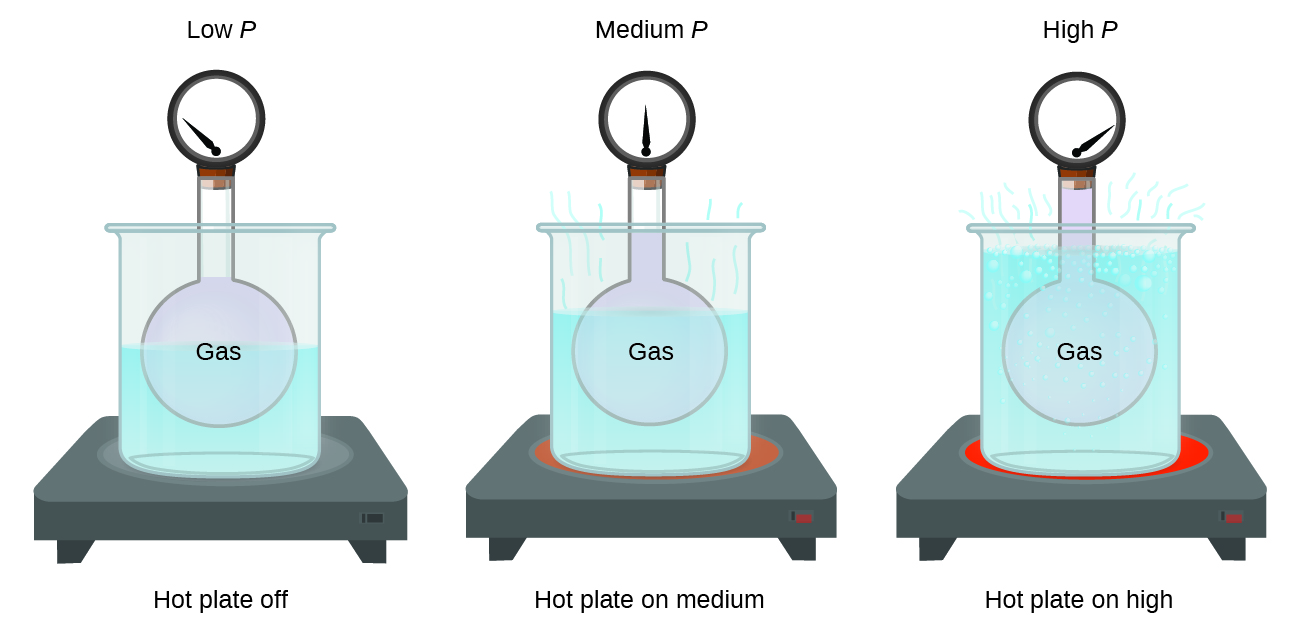
This figure includes three similar diagrams. In the first diagram to the left, a rigid spherical container of a gas to which a pressure gauge is attached at the top is placed in a large beaker of water, indicated in light blue, atop a hot plate. The needle on the pressure gauge points to the far left on the gauge. The diagram is labeled “low P” above and “hot plate off” below. The second similar diagram also has the rigid spherical container of gas placed in a large beaker from which light blue wavy line segments extend from the top of the liquid in the beaker. The beaker is situated on top of a slightly reddened circular area. The needle on the pressure gauge points straight up, or to the middle on the gauge. The diagram is labeled “medium P” above and “hot plate on medium” below. The third diagram also has the rigid spherical container of gas placed in a large beaker in which bubbles appear near the liquid surface and several wavy light blue line segments extend from the surface out of the beaker. The beaker is situated on top of a bright red circular area. The needle on the pressure gauge points to the far right on the gauge. The diagram is labeled “high P” above and “hot plate on high” below.
The effect of temperature on gas pressure: When the hot plate is off, the pressure of the gas in the sphere is relatively low. As the gas is heated, the pressure of the gas in the sphere increases.

This relationship between temperature and pressure is observed for any sample of gas confined to a constant volume. An example of experimental pressure-temperature data is shown for a sample of air under these conditions in [link] . We find that temperature and pressure are linearly related, and if the temperature is on the kelvin scale, then P and T are directly proportional (again, when volume and moles of gas are held constant ); if the temperature on the kelvin scale increases by a certain factor, the gas pressure increases by the same factor.

This figure includes a table and a graph. The table has 3 columns and 7 rows. The first row is a header, which labels the columns “Temperature, degrees C,” “Temperature, K,” and “Pressure, k P a.” The first column contains the values from top to bottom negative 150, negative 100, negative 50, 0, 50, and 100. The second column contains the values from top to bottom 173, 223, 273, 323, 373, and 423. The third column contains the values 36.0, 46.4, 56.7, 67.1, 77.5, and 88.0. A graph appears to the right of the table. The horizontal axis is labeled “Temperature ( K ).” with markings and labels provided for multiples of 100 beginning at 0 and ending at 500. The vertical axis is labeled “Pressure ( k P a )” with markings and labels provided for multiples of 10, beginning at 0 and ending at 100. Six data points from the table are plotted on the graph with black dots. These dots are connected with a solid black line. A dashed line extends from the data point furthest to the left to the origin. The graph shows a positive linear trend.
For a constant volume and amount of air, the pressure and temperature are directly proportional, provided the temperature is in kelvin. (Measurements cannot be made at lower temperatures because of the condensation of the gas.) When this line is extrapolated to lower pressures, it reaches a pressure of 0 at –273 °C, which is 0 on the kelvin scale and the lowest possible temperature, called absolute zero.

Get Jobilize Job Search Mobile App in your pocket Now!

Get it on Google Play Download on the App Store Now


Source:  OpenStax, Chemistry. OpenStax CNX. May 20, 2015 Download for free at http://legacy.cnx.org/content/col11760/1.9
Google Play and the Google Play logo are trademarks of Google Inc.

Notification Switch

Would you like to follow the 'Chemistry' conversation and receive update notifications?

Ask