<< Chapter < Page Chapter >> Page >

Polynomials

A linear function is a special type of a more general class of functions: polynomials. A polynomial function    is any function that can be written in the form

f ( x ) = a n x n + a n 1 x n 1 + + a 1 x + a 0

for some integer n 0 and constants a n , a n 1 ,…, a 0 , where a n 0 . In the case when n = 0 , we allow for a 0 = 0 ; if a 0 = 0 , the function f ( x ) = 0 is called the zero function . The value n is called the degree    of the polynomial; the constant a n is called the leading coefficient . A linear function of the form f ( x ) = m x + b is a polynomial of degree 1 if m 0 and degree 0 if m = 0 . A polynomial of degree 0 is also called a constant function . A polynomial function of degree 2 is called a quadratic function    . In particular, a quadratic function has the form f ( x ) = a x 2 + b x + c , where a 0 . A polynomial function of degree 3 is called a cubic function    .

Power functions

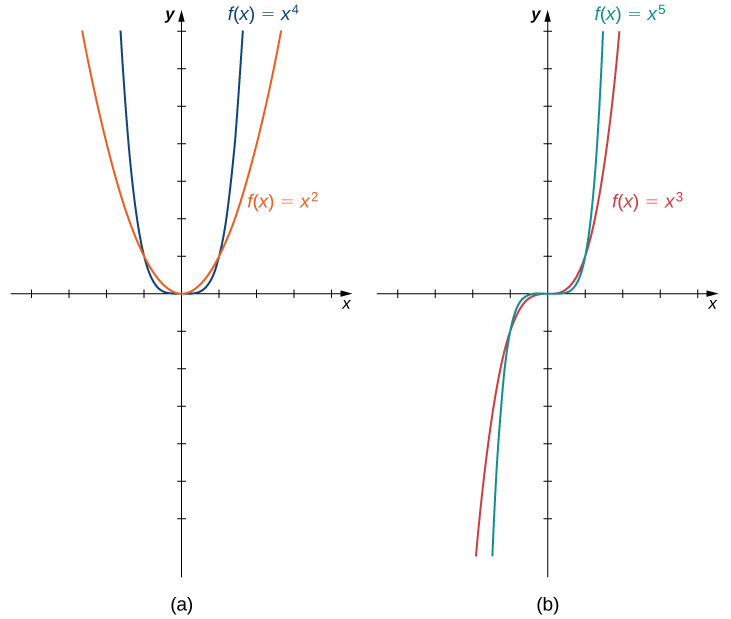
Some polynomial functions are power functions. A power function    is any function of the form f ( x ) = a x b , where a and b are any real numbers. The exponent in a power function can be any real number, but here we consider the case when the exponent is a positive integer. (We consider other cases later.) If the exponent is a positive integer, then f ( x ) = a x n is a polynomial. If n is even, then f ( x ) = a x n is an even function because f ( x ) = a ( x ) n = a x n if n is even. If n is odd, then f ( x ) = a x n is an odd function because f ( x ) = a ( x ) n = a x n if n is odd ( [link] ).

An image of two graphs. Both graphs have an x axis that runs from -4 to 4 and a y axis that runs from -6 to 7. The first graph is labeled “a” and is of two functions. The first function is “f(x) = x to the 4th”, which is a parabola that decreases until the origin and then increases again after the origin. The second function is “f(x) = x squared”, which is a parabola that decreases until the origin and then increases again after the origin, but increases and decreases at a slower rate than the first function. The second graph is labeled “b” and is of two functions. The first function is “f(x) = x to the 5th”, which is a curved function that increases until the origin, becomes even at the origin, and then increases again after the origin. The second function is “f(x) = x cubed”, which is a curved function that increases until the origin, becomes even at the origin, and then increases again after the origin, but increases at a slower rate than the first function.
(a) For any even integer n , f ( x ) = a x n is an even function. (b) For any odd integer n , f ( x ) = a x n is an odd function.

Behavior at infinity

To determine the behavior of a function f as the inputs approach infinity, we look at the values f ( x ) as the inputs, x , become larger. For some functions, the values of f ( x ) approach a finite number. For example, for the function f ( x ) = 2 + 1 / x , the values 1 / x become closer and closer to zero for all values of x as they get larger and larger. For this function, we say f ( x ) approaches two as x goes to infinity,” and we write f ( x ) 2 as x . The line y = 2 is a horizontal asymptote for the function f ( x ) = 2 + 1 / x because the graph of the function gets closer to the line as x gets larger.

For other functions, the values f ( x ) may not approach a finite number but instead may become larger for all values of x as they get larger. In that case, we say f ( x ) approaches infinity as x approaches infinity,” and we write f ( x ) as x . For example, for the function f ( x ) = 3 x 2 , the outputs f ( x ) become larger as the inputs x get larger. We can conclude that the function f ( x ) = 3 x 2 approaches infinity as x approaches infinity, and we write 3 x 2 as x . The behavior as x and the meaning of f ( x ) as x or x can be defined similarly. We can describe what happens to the values of f ( x ) as x and as x as the end behavior of the function.

To understand the end behavior for polynomial functions, we can focus on quadratic and cubic functions. The behavior for higher-degree polynomials can be analyzed similarly. Consider a quadratic function f ( x ) = a x 2 + b x + c . If a > 0 , the values f ( x ) as x ± . If a < 0 , the values f ( x ) −∞ as x ± . Since the graph of a quadratic function is a parabola, the parabola opens upward if a > 0 ; the parabola opens downward if a < 0 . (See [link] (a).)

Questions & Answers

how do you get the 2/50
Abba Reply
number of sport play by 50 student construct discrete data
Aminu Reply
width of the frangebany leaves on how to write a introduction
Theresa Reply
Solve the mean of variance
Veronica Reply
Step 1: Find the mean. To find the mean, add up all the scores, then divide them by the number of scores. ... Step 2: Find each score's deviation from the mean. ... Step 3: Square each deviation from the mean. ... Step 4: Find the sum of squares. ... Step 5: Divide the sum of squares by n – 1 or N.
kenneth
what is error
Yakuba Reply
Is mistake done to something
Vutshila
Hy
anas
hy
What is the life teble
anas
hy
Jibrin
statistics is the analyzing of data
Tajudeen Reply
what is statics?
Zelalem Reply
how do you calculate mean
Gloria Reply
diveving the sum if all values
Shaynaynay
let A1,A2 and A3 events be independent,show that (A1)^c, (A2)^c and (A3)^c are independent?
Fisaye Reply
what is statistics
Akhisani Reply
data collected all over the world
Shaynaynay
construct a less than and more than table
Imad Reply
The sample of 16 students is taken. The average age in the sample was 22 years with astandard deviation of 6 years. Construct a 95% confidence interval for the age of the population.
Aschalew Reply
Bhartdarshan' is an internet-based travel agency wherein customer can see videos of the cities they plant to visit. The number of hits daily is a normally distributed random variable with a mean of 10,000 and a standard deviation of 2,400 a. what is the probability of getting more than 12,000 hits? b. what is the probability of getting fewer than 9,000 hits?
Akshay Reply
Bhartdarshan'is an internet-based travel agency wherein customer can see videos of the cities they plan to visit. The number of hits daily is a normally distributed random variable with a mean of 10,000 and a standard deviation of 2,400. a. What is the probability of getting more than 12,000 hits
Akshay
1
Bright
Sorry i want to learn more about this question
Bright
Someone help
Bright
a= 0.20233 b=0.3384
Sufiyan
a
Shaynaynay
How do I interpret level of significance?
Mohd Reply
It depends on your business problem or in Machine Learning you could use ROC- AUC cruve to decide the threshold value
Shivam
how skewness and kurtosis are used in statistics
Owen Reply
yes what is it
Taneeya
Got questions? Join the online conversation and get instant answers!
Jobilize.com Reply

Get Jobilize Job Search Mobile App in your pocket Now!

Get it on Google Play Download on the App Store Now


Source:  OpenStax, Calculus volume 1. OpenStax CNX. Feb 05, 2016 Download for free at http://cnx.org/content/col11964/1.2
Google Play and the Google Play logo are trademarks of Google Inc.

Notification Switch

Would you like to follow the 'Calculus volume 1' conversation and receive update notifications?

Ask