<< Chapter < Page Chapter >> Page >

Sketch a graph of the function

f ( x ) = { 2 x , x 2 x + 2 , x > 2 .


An image of a graph. The x axis runs from -6 to 5 and the y axis runs from -2 to 7. The graph is of a function that has two pieces. The first piece is a decreasing line that ends at the closed circle point (2, 0) and has the label “f(x) = 2 - x, for x <= 2. The second piece is an increasing line and begins at the open circle point (2, 4) and has the label “f(x) = x + 2, for x > 2.The function has an x intercept at (2, 0) and a y intercept at (0, 2).

Got questions? Get instant answers now!

Parking fees described by a piecewise-defined function

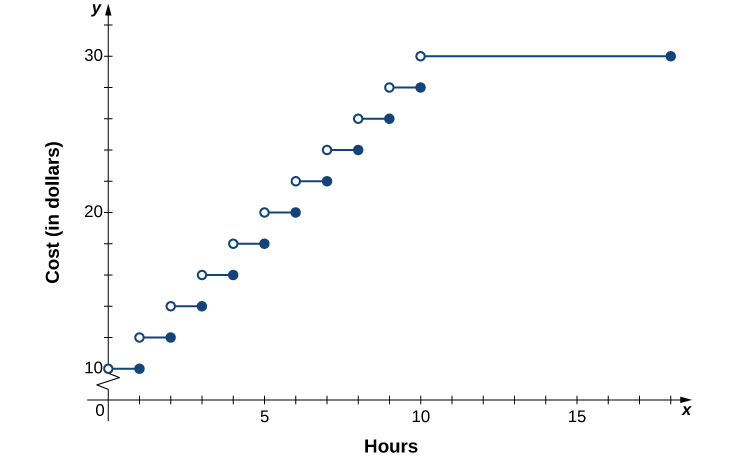
In a big city, drivers are charged variable rates for parking in a parking garage. They are charged $10 for the first hour or any part of the first hour and an additional $2 for each hour or part thereof up to a maximum of $30 for the day. The parking garage is open from 6 a.m. to 12 midnight.

  1. Write a piecewise-defined function that describes the cost C to park in the parking garage as a function of hours parked x .
  2. Sketch a graph of this function C ( x ) .
  1. Since the parking garage is open 18 hours each day, the domain for this function is { x | 0 < x 18 } . The cost to park a car at this parking garage can be described piecewise by the function
    C ( x ) = { 10 , 0 < x 1 12 , 1 < x 2 14 , 2 < x 3 16 , 3 < x 4 30 , 10 < x 18 .
  2. The graph of the function consists of several horizontal line segments.
    An image of a graph. The x axis runs from 0 to 18 and is labeled “x, hours”. The y axis runs from 0 to 32 and is labeled “y, cost in dollars”. The function consists 11 pieces, all horizontal line segments that begin with an open circle and end with a closed circle. The first piece starts at x = 0 and ends at x = 1 and is at y = 10. The second piece starts at x = 1 and ends at x = 2 and is at y = 12. The third piece starts at x = 2 and ends at x = 3 and is at y = 14. The fourth piece starts at x = 3 and ends at x = 4 and is at y = 16. The fifth piece starts at x = 4 and ends at x = 5 and is at y = 18. The sixth piece starts at x = 5 and ends at x = 6 and is at y = 20. The seventh piece starts at x = 6 and ends at x = 7 and is at y = 22. The eighth piece starts at x = 7 and ends at x = 8 and is at y = 24. The ninth piece starts at x = 8 and ends at x = 9 and is at y = 26. The tenth piece starts at x = 9 and ends at x = 10 and is at y = 28. The eleventh piece starts at x = 10 and ends at x = 18 and is at y = 30.
Got questions? Get instant answers now!

The cost of mailing a letter is a function of the weight of the letter. Suppose the cost of mailing a letter is 49 ¢ for the first ounce and 21 ¢ for each additional ounce. Write a piecewise-defined function describing the cost C as a function of the weight x for 0 < x 3 , where C is measured in cents and x is measured in ounces.

C ( x ) = { 49 , 0 < x 1 70 , 1 < x 2 91 , 2 < x 3

Got questions? Get instant answers now!

Transformations of functions

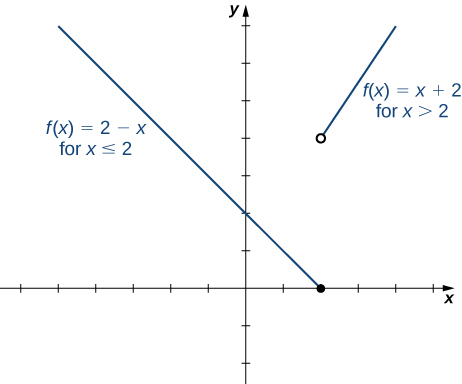
We have seen several cases in which we have added, subtracted, or multiplied constants to form variations of simple functions. In the previous example, for instance, we subtracted 2 from the argument of the function y = x 2 to get the function f ( x ) = ( x 2 ) 2 . This subtraction represents a shift of the function y = x 2 two units to the right. A shift, horizontally or vertically, is a type of transformation of a function    . Other transformations include horizontal and vertical scalings, and reflections about the axes.

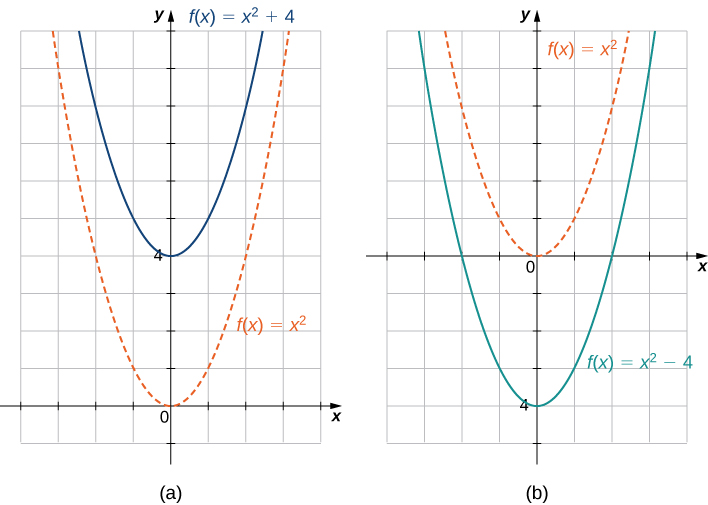
A vertical shift of a function occurs if we add or subtract the same constant to each output y . For c > 0 , the graph of f ( x ) + c is a shift of the graph of f ( x ) up c units, whereas the graph of f ( x ) c is a shift of the graph of f ( x ) down c units. For example, the graph of the function f ( x ) = x 3 + 4 is the graph of y = x 3 shifted up 4 units; the graph of the function f ( x ) = x 3 4 is the graph of y = x 3 shifted down 4 units ( [link] ).

An image of two graphs. The first graph is labeled “a” and has an x axis that runs from -4 to 4 and a y axis that runs from -1 to 10. The graph is of two functions. The first function is “f(x) = x squared”, which is a parabola that decreases until the origin and then increases again after the origin. The second function is “f(x) = (x squared) + 4”, which is a parabola that decreases until the point (0, 4) and then increases again after the origin. The two functions are the same in shape, but the second function is shifted up 4 units. The second graph is labeled “b” and has an x axis that runs from -4 to 4 and a y axis that runs from -5 to 6. The graph is of two functions. The first function is “f(x) = x squared”, which is a parabola that decreases until the origin and then increases again after the origin. The second function is “f(x) = (x squared) - 4”, which is a parabola that decreases until the point (0, -4) and then increases again after the origin. The two functions are the same in shape, but the second function is shifted down 4 units.
(a) For c > 0 , the graph of y = f ( x ) + c is a vertical shift up c units of the graph of y = f ( x ) . (b) For c > 0 , the graph of y = f ( x ) c is a vertical shift down c units of the graph of y = f ( x ) .

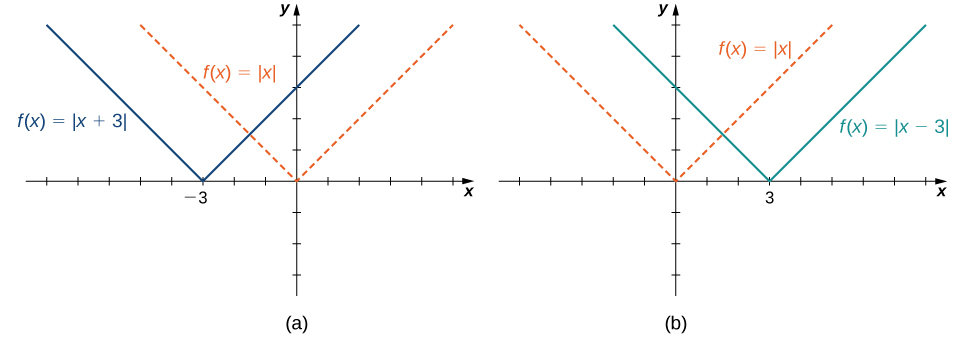
A horizontal shift of a function occurs if we add or subtract the same constant to each input x . For c > 0 , the graph of f ( x + c ) is a shift of the graph of f ( x ) to the left c units; the graph of f ( x c ) is a shift of the graph of f ( x ) to the right c units. Why does the graph shift left when adding a constant and shift right when subtracting a constant? To answer this question, let’s look at an example.

Consider the function f ( x ) = | x + 3 | and evaluate this function at x 3 . Since f ( x 3 ) = | x | and x 3 < x , the graph of f ( x ) = | x + 3 | is the graph of y = | x | shifted left 3 units. Similarly, the graph of f ( x ) = | x 3 | is the graph of y = | x | shifted right 3 units ( [link] ).

An image of two graphs. The first graph is labeled “a” and has an x axis that runs from -8 to 5 and a y axis that runs from -3 to 5. The graph is of two functions. The first function is “f(x) = absolute value of x”, which decreases in a straight line until the origin and then increases in a straight line again after the origin. The second function is “f(x) = absolute value of (x + 3)”, which decreases in a straight line until the point (-3, 0) and then increases in a straight line again after the point (-3, 0). The two functions are the same in shape, but the second function is shifted left 3 units. The second graph is labeled “b” and has an x axis that runs from -5 to 8 and a y axis that runs from -3 to 5. The graph is of two functions. The first function is “f(x) = absolute value of x”, which decreases in a straight line until the origin and then increases in a straight line again after the origin. The second function is “f(x) = absolute value of (x - 3)”, which decreases in a straight line until the point (3, 0) and then increases in a straight line again after the point (3, 0). The two functions are the same in shape, but the second function is shifted right 3 units.
(a) For c > 0 , the graph of y = f ( x + c ) is a horizontal shift left c units of the graph of y = f ( x ) . (b) For c > 0 , the graph of y = f ( x c ) is a horizontal shift right c units of the graph of y = f ( x ) .

Get Jobilize Job Search Mobile App in your pocket Now!

Get it on Google Play Download on the App Store Now


Source:  OpenStax, Calculus volume 1. OpenStax CNX. Feb 05, 2016 Download for free at http://cnx.org/content/col11964/1.2
Google Play and the Google Play logo are trademarks of Google Inc.

Notification Switch

Would you like to follow the 'Calculus volume 1' conversation and receive update notifications?

Ask