

| << Chapter < Page | Chapter >> Page > |
Each of the LIGO stations consists of two 4-kilometer-long, 1.2-meter-diameter vacuum pipes arranged in an L-shape. A test mass with a mirror on it is suspended by wire at each of the four ends of the pipes. Ultra-stable laser light is reflected from the mirrors and travels back and forth along the vacuum pipes ( [link] ). If gravitational waves pass through the LIGO instrument, then, according to Einstein’s theory, the waves will affect local spacetime—they will alternately stretch and shrink the distance the laser light must travel between the mirrors ever so slightly. When one arm of the instrument gets longer, the other will get shorter, and vice versa.
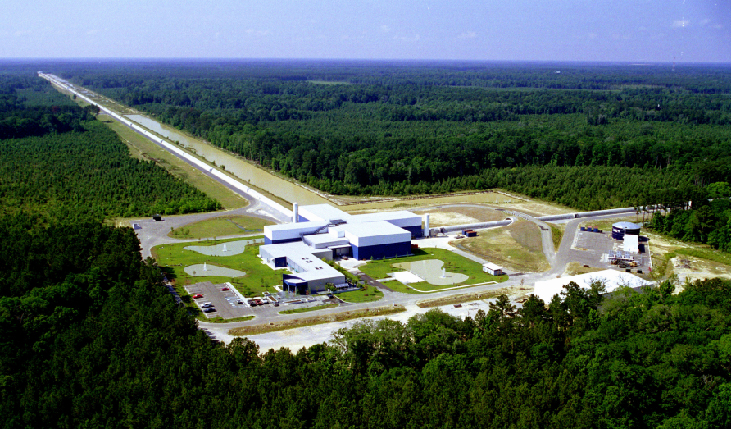
The challenge of this experiment lies in that phrase “ever so slightly.” In fact, to detect a gravitational wave, the change in the distance to the mirror must be measured with an accuracy of one ten-thousandth the diameter of a proton . In 1972, Rainer Weiss of MIT wrote a paper suggesting how this seemingly impossible task might be accomplished.
A great deal of new technology had to be developed, and work on the laboratory, with funding from the National Science Foundation, began in 1979. A full-scale prototype to demonstrate the technology was built and operated from 2002 to 2010, but the prototype was not expected to have the sensitivity required to actually detect gravitational waves from an astronomical source. Advanced LIGO, built to be more precise with the improved technology developed in the prototype, went into operation in 2015—and almost immediately detected gravitational waves.
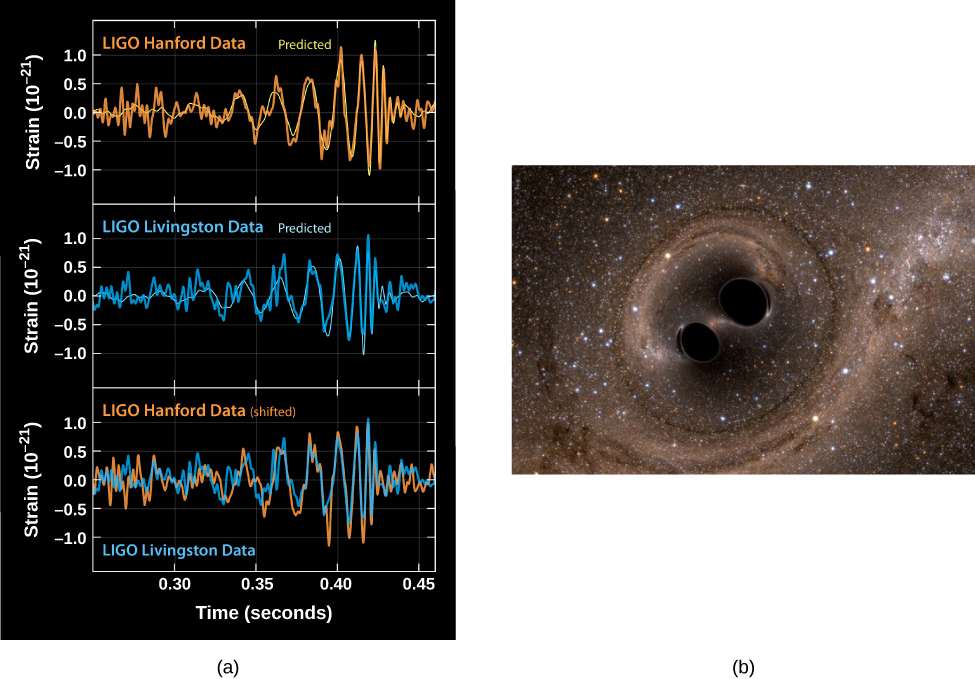
What LIGO found was gravitational wave s produced in the final fraction of a second of the merger of two black holes ( [link] ). The black holes had masses of 20 and 36 times the mass of the Sun, and the merger took place 1.3 billion years ago—the gravitational waves occurred so far away that it has taken that long for them, traveling at the speed of light, to reach us.
In the cataclysm of the merger, about three times the mass of the Sun was converted to energy (recall E = mc 2 ). During the tiny fraction of a second for the merger to take place, this event produced power about 50 times the power produced by all the stars in the entire visible universe—but the power was all in the form of gravitational waves and hence was invisible to our instruments, except to LIGO. The event was recorded in Louisiana about 7 milliseconds before the detection in Washington—just the right distance given the speed at which gravitational waves travel—and indicates that the source was located somewhere in the southern hemisphere sky. Unfortunately, the merger of two black holes is not expected to produce any light, so this is the only observation we have of the event.
Notification Switch
Would you like to follow the 'Astronomy' conversation and receive update notifications?

|
|

|
|

|
|

|
|

|
|
|
|
|

|
|

|
|

|
|

|