<< Chapter < Page Chapter >> Page >

Learning objectives

By the end of this section, you will be able to:

  • Identify the physical characteristics of stars that are used to create an H–R diagram, and describe how those characteristics vary among groups of stars
  • Discuss the physical properties of most stars found at different locations on the H–R diagram, such as radius, and for main sequence stars, mass

In this chapter and Analyzing Starlight , we described some of the characteristics by which we might classify stars and how those are measured. These ideas are summarized in [link] . We have also given an example of a relationship between two of these characteristics in the mass-luminosity relation. When the characteristics of large numbers of stars were measured at the beginning of the twentieth century, astronomers were able to begin a deeper search for patterns and relationships in these data.

Measuring the Characteristics of Stars
Characteristic Technique
Surface temperature

1. Determine the color (very rough).

2. Measure the spectrum and get the spectral type.

Chemical composition Determine which lines are present in the spectrum.
Luminosity Measure the apparent brightness and compensate for distance.
Radial velocity Measure the Doppler shift in the spectrum.
Rotation Measure the width of spectral lines.
Mass Measure the period and radial velocity curves of spectroscopic binary stars.
Diameter

1. Measure the way a star’s light is blocked by the Moon.

2. Measure the light curves and Doppler shifts for eclipsing binary stars.

To help understand what sorts of relationships might be found, let’s look briefly at a range of data about human beings. If you want to understand humans by comparing and contrasting their characteristics—without assuming any previous knowledge of these strange creatures—you could try to determine which characteristics lead you in a fruitful direction. For example, you might plot the heights of a large sample of humans against their weights (which is a measure of their mass). Such a plot is shown in [link] and it has some interesting features. In the way we have chosen to present our data, height increases upward, whereas weight increases to the left. Notice that humans are not randomly distributed in the graph. Most points fall along a sequence that goes from the upper left to the lower right.

Height versus weight.

Graph of Height Versus Weight. The vertical axis is labeled “Height” in arbitrary units. The horizontal axis is labeled “Weight” in arbitrary units. A plot of dots shows a general trend of weight increasing as height increases, with a few outliers above and below.
The plot of the heights and weights of a representative group of human beings. Most points lie along a “main sequence” representing most people, but there are a few exceptions.

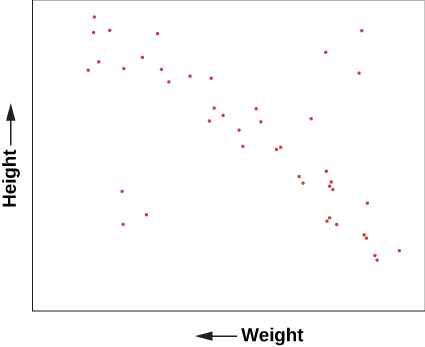
We can conclude from this graph that human height and weight are related. Generally speaking, taller human beings weigh more, whereas shorter ones weigh less. This makes sense if you are familiar with the structure of human beings. Typically, if we have bigger bones, we have more flesh to fill out our larger frame. It’s not mathematically exact—there is a wide range of variation—but it’s not a bad overall rule. And, of course, there are some dramatic exceptions. You occasionally see a short human who is very overweight and would thus be more to the bottom left of our diagram than the average sequence of people. Or you might have a very tall, skinny fashion model with great height but relatively small weight, who would be found near the upper right.

Questions & Answers

how do you get the 2/50
Abba Reply
number of sport play by 50 student construct discrete data
Aminu Reply
width of the frangebany leaves on how to write a introduction
Theresa Reply
Solve the mean of variance
Veronica Reply
Step 1: Find the mean. To find the mean, add up all the scores, then divide them by the number of scores. ... Step 2: Find each score's deviation from the mean. ... Step 3: Square each deviation from the mean. ... Step 4: Find the sum of squares. ... Step 5: Divide the sum of squares by n – 1 or N.
kenneth
what is error
Yakuba Reply
Is mistake done to something
Vutshila
Hy
anas
hy
What is the life teble
anas
hy
Jibrin
statistics is the analyzing of data
Tajudeen Reply
what is statics?
Zelalem Reply
how do you calculate mean
Gloria Reply
diveving the sum if all values
Shaynaynay
let A1,A2 and A3 events be independent,show that (A1)^c, (A2)^c and (A3)^c are independent?
Fisaye Reply
what is statistics
Akhisani Reply
data collected all over the world
Shaynaynay
construct a less than and more than table
Imad Reply
The sample of 16 students is taken. The average age in the sample was 22 years with astandard deviation of 6 years. Construct a 95% confidence interval for the age of the population.
Aschalew Reply
Bhartdarshan' is an internet-based travel agency wherein customer can see videos of the cities they plant to visit. The number of hits daily is a normally distributed random variable with a mean of 10,000 and a standard deviation of 2,400 a. what is the probability of getting more than 12,000 hits? b. what is the probability of getting fewer than 9,000 hits?
Akshay Reply
Bhartdarshan'is an internet-based travel agency wherein customer can see videos of the cities they plan to visit. The number of hits daily is a normally distributed random variable with a mean of 10,000 and a standard deviation of 2,400. a. What is the probability of getting more than 12,000 hits
Akshay
1
Bright
Sorry i want to learn more about this question
Bright
Someone help
Bright
a= 0.20233 b=0.3384
Sufiyan
a
Shaynaynay
How do I interpret level of significance?
Mohd Reply
It depends on your business problem or in Machine Learning you could use ROC- AUC cruve to decide the threshold value
Shivam
how skewness and kurtosis are used in statistics
Owen Reply
yes what is it
Taneeya
Got questions? Join the online conversation and get instant answers!
Jobilize.com Reply

Get Jobilize Job Search Mobile App in your pocket Now!

Get it on Google Play Download on the App Store Now


Source:  OpenStax, Astronomy. OpenStax CNX. Apr 12, 2017 Download for free at http://cnx.org/content/col11992/1.13
Google Play and the Google Play logo are trademarks of Google Inc.

Notification Switch

Would you like to follow the 'Astronomy' conversation and receive update notifications?

Ask