Class Time: __________________________
Name: _____________________________________
H
0 : _______
H
a : _______
In words,
CLEARLY state what your random variable
or
represents.
State the distribution to use for the test.
What is the test statistic?
What is the
p -value? In one or two complete sentences, explain what the
p -value means for this problem.
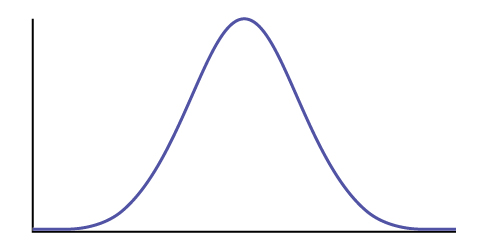
Use the previous information to sketch a picture of this situation. CLEARLY, label and scale the horizontal axis and shade the region(s) corresponding to the
p -value.
Indicate the correct decision (“reject” or “do not reject” the null hypothesis), the reason for it, and write an appropriate conclusion, using
complete sentences .
Alpha: _______
Decision: _______
Reason for decision: _______
Conclusion: _______
Construct a 95% confidence interval for the true mean or proportion. Include a sketch of the graph of the situation. Label the point estimate and the lower and upper bounds of the confidence interval.
Hypothesis testing with two samples
Class Time: __________________________
Name: _____________________________________
H
0 : _______
H
a : _______
In words,
clearly state what your random variable
,
or
represents.
State the distribution to use for the test.
What is the test statistic?
What is the
p -value? In one to two complete sentences, explain what the p-value means for this problem.
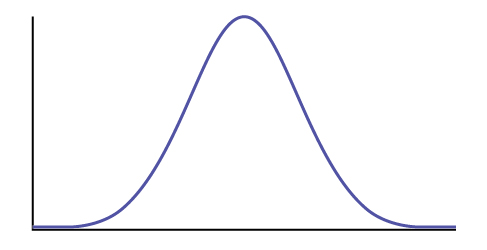
Use the previous information to sketch a picture of this situation.
CLEARLY label and scale the horizontal axis and shade the region(s) corresponding to the
p -value.
Indicate the correct decision (“reject” or “do not reject” the null hypothesis), the reason for it, and write an appropriate conclusion, using
complete sentences .
Alpha: _______
Decision: _______
Reason for decision: _______
Conclusion: _______
In complete sentences, explain how you determined which distribution to use.
The chi-square distribution
Class Time: __________________________
Name: ____________________________________
H
0 : _______
H
a : _______
What are the degrees of freedom?
State the distribution to use for the test.
What is the test statistic?
What is the
p -value? In one to two complete sentences, explain what the
p -value means for this problem.
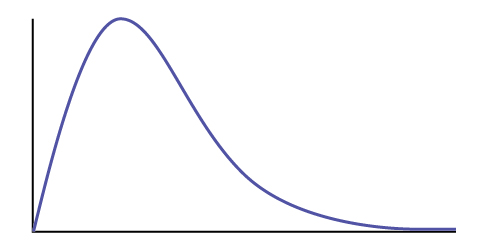
Use the previous information to sketch a picture of this situation.
Clearly label and scale the horizontal axis and shade the region(s) corresponding to the
p -value.
Indicate the correct decision (“reject” or “do not reject” the null hypothesis) and write appropriate conclusions, using
complete sentences.
Alpha: _______
Decision: _______
Reason for decision: _______
Conclusion: _______
F distribution and one-way anova
Class Time: __________________________
Name: ____________________________________
H
0 : _______
H
a : _______
df (
n ) = ______
df (
d ) = _______
State the distribution to use for the test.
What is the test statistic?
What is the
p -value?
Use the previous information to sketch a picture of this situation.
Clearly label and scale the horizontal axis and shade the region(s) corresponding to the
p -value.
Indicate the correct decision (“reject” or “do not reject” the null hypothesis) and write appropriate conclusions, using
complete sentences .
the study of living organisms and their interactions with one another and their environment.
Wine
discuss the biological phenomenon and provide pieces of evidence to show that it was responsible for the formation of eukaryotic organelles in an essay form