We have explored a number of seemingly complex polar curves in this section.
[link] and
[link] summarize the graphs and equations for each of these curves.
Access these online resources for additional instruction and practice with graphs of polar coordinates.
It is easier to graph polar equations if we can test the equations for symmetry with respect to the line
the polar axis, or the pole.
There are three symmetry tests that indicate whether the graph of a polar equation will exhibit symmetry. If an equation fails a symmetry test, the graph may or may not exhibit symmetry. See
[link] .
Polar equations may be graphed by making a table of values for
and
The maximum value of a polar equation is found by substituting the value
that leads to the maximum value of the trigonometric expression.
The zeros of a polar equation are found by setting
and solving for
See
[link] .
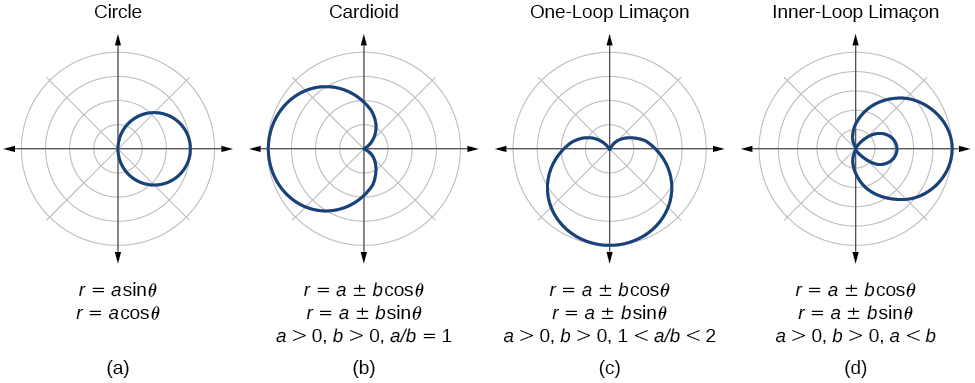
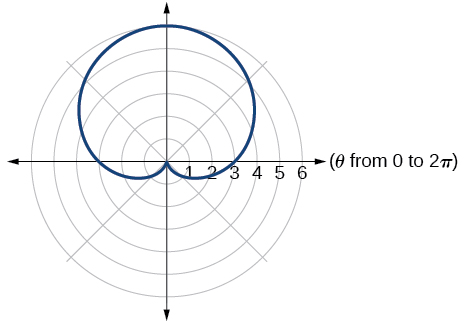
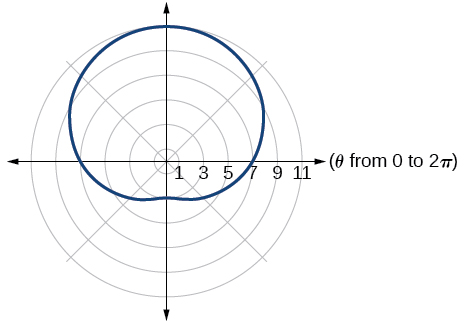
Some formulas that produce the graph of a circle in polar coordinates are given by
and
See
[link] .
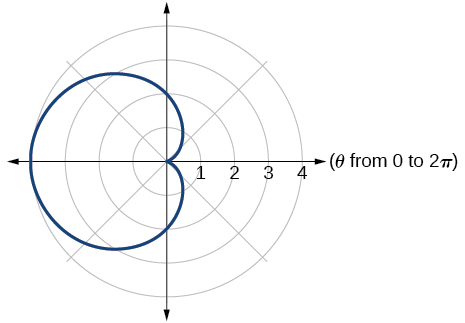
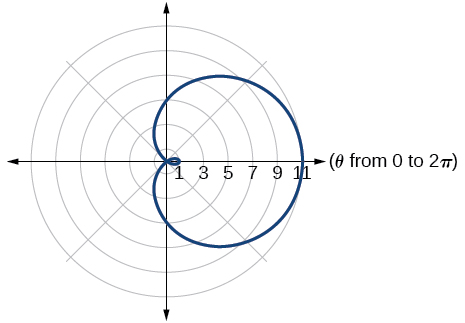
The formulas that produce the graphs of a cardioid are given by
and
for
and
See
[link] .
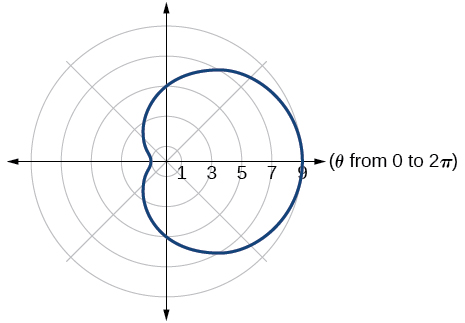
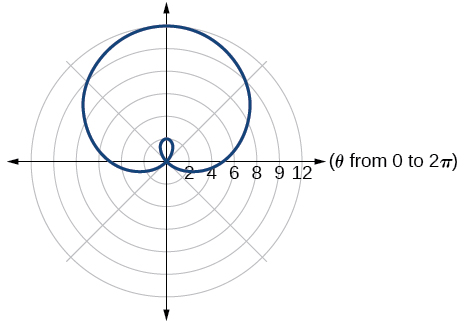
The formulas that produce the graphs of a one-loop limaçon are given by
and
for
See
[link] .
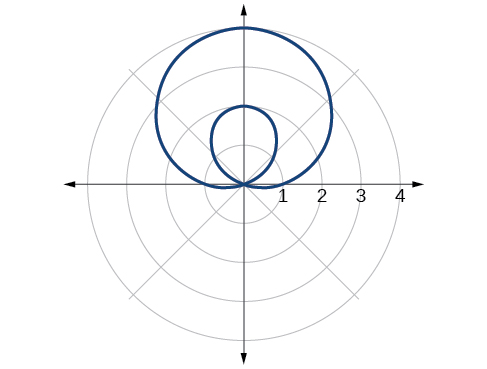
The formulas that produce the graphs of an inner-loop limaçon are given by
and
for
and
See
[link] .
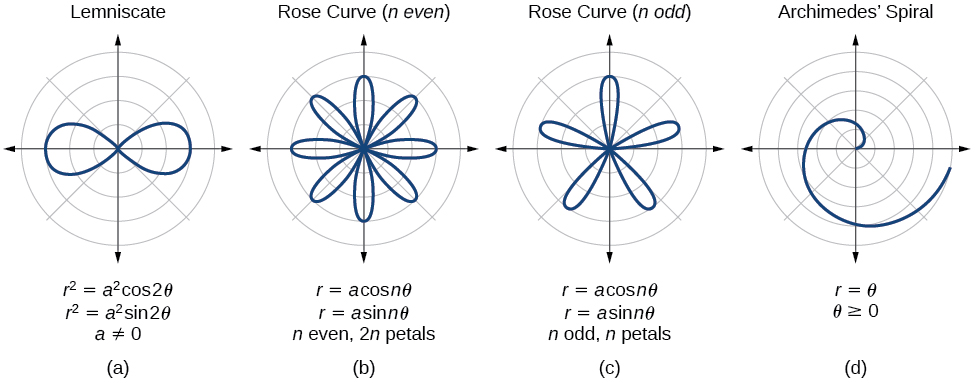
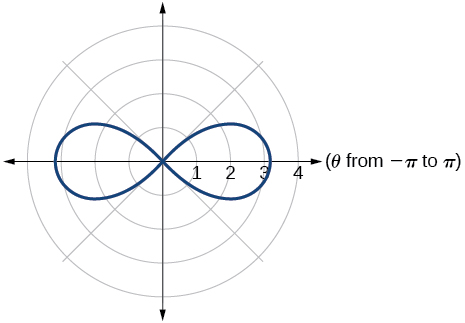
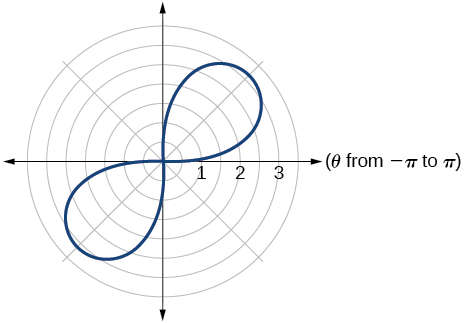
The formulas that produce the graphs of a lemniscates are given by
and
where
See
[link] .
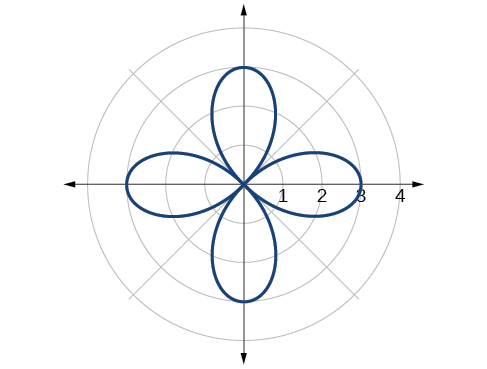
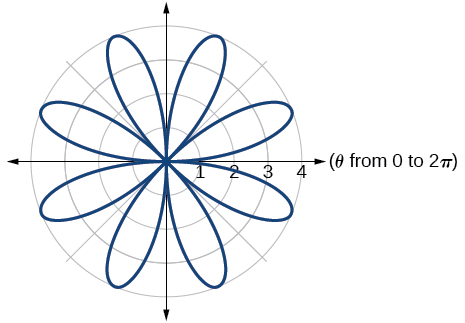
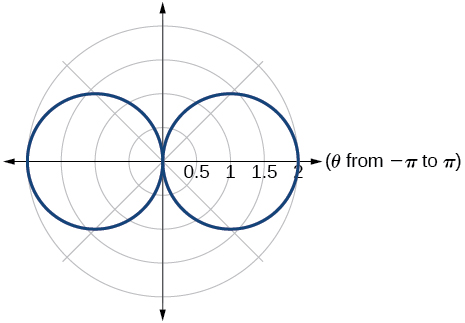
The formulas that produce the graphs of rose curves are given by
and
where
if
is even, there are
petals, and if
is odd, there are
petals. See
[link] and
[link] .
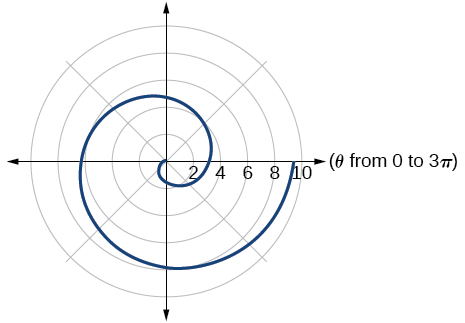
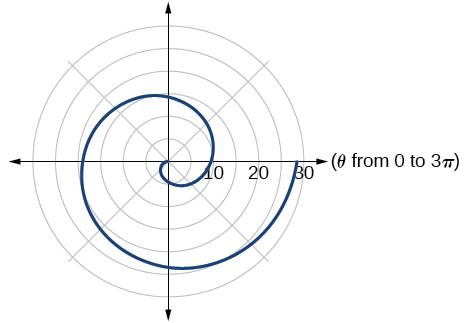
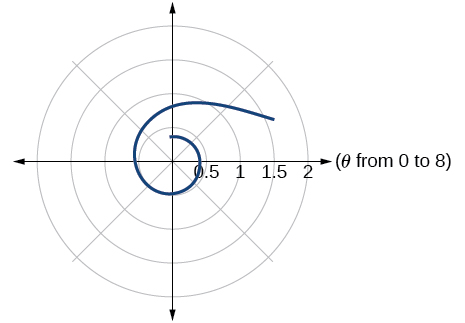
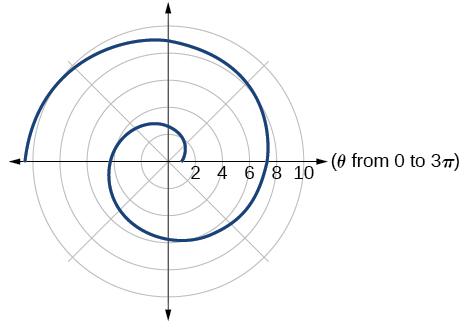
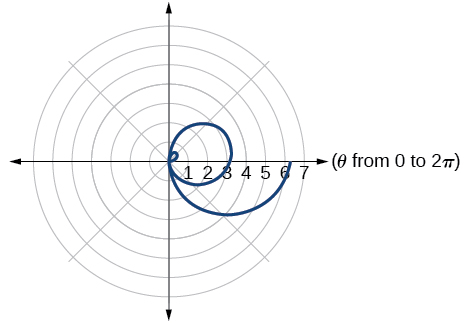
The formula that produces the graph of an Archimedes’ spiral is given by
See
[link] .
Section exercises
Verbal
Describe the three types of symmetry in polar graphs, and compare them to the symmetry of the Cartesian plane.
Symmetry with respect to the polar axis is similar to symmetry about the
-axis, symmetry with respect to the pole is similar to symmetry about the origin, and symmetric with respect to the line
is similar to symmetry about the
-axis.
What are the steps to follow when graphing polar equations?
Test for symmetry; find zeros, intercepts, and maxima; make a table of values. Decide the general type of graph, cardioid, limaçon, lemniscate, etc., then plot points at
and sketch the graph.
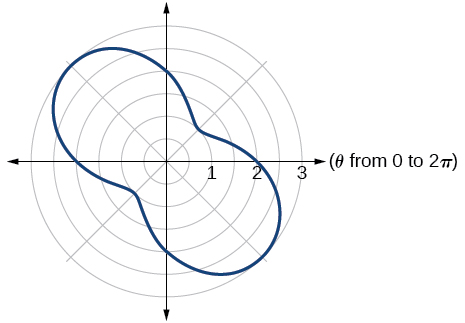
For the following exercises, use a graphing utility to graph each pair of polar equations on a domain of
and then explain the differences shown in the graphs.
Both graphs are curves with 2 loops. The equation with a coefficient of
has two loops on the left, the equation with a coefficient of 2 has two loops side by side. Graph these from 0 to
to get a better picture.
is it possible to leave every good at the same level
Joseph
I don't think so. because check it, if the demand for chicken increases, people will no longer consume fish like they used to causing a fall in the demand for fish
Anuolu
is not really possible to let the value of a goods to be same at the same time.....
Salome
Suppose the inflation rate is 6%, does it mean that all the goods you purchase will cost
6% more than previous year? Provide with reasoning.
Not necessarily. To measure the inflation rate economists normally use an averaged price index of a basket of certain goods. So if you purchase goods included in the basket, you will notice that you pay 6% more, otherwise not necessarily.
Good day
How do I calculate this question: C= 100+5yd G= 2000 T= 2000 I(planned)=200.
Suppose the actual output is 3000. What is the level of planned expenditures at this level of output?
I am Camara from Guinea west Africa... happy to meet you guys here
Sekou
ma management ho
Amisha
ahile becheclor ho
Amisha
hjr ktm bta ho
ani k kaam grnu hunxa tw
Amisha
belatari
Amisha
1st year ho
Amisha
nd u
Amisha
ahh
Amisha
kaha biratnagar
Amisha
ys
Amisha
kina k vo
Amisha
money as unit of account means what?
Kalombe
A unit of account is something that can be used to value goods and services and make calculations
Jim
all of you please speak in English I can't understand you're language
Muhammad
I want to know how can we define macroeconomics in one line
Muhammad
it must be .9 or 0.9
no Mpc is greater than 1
Y=100+.9Y+50
Y-.9Y=150
0.1Y/0.1=150/0.1
Y=1500
Kalombe
Mercy is it clear?😋
Kalombe
hi can someone help me on this question
If a negative shocks shifts the IS curve to the left, what type of policy do you suggest so as to stabilize the level of output?
discuss your answer using appropriate graph.