<< Chapter < Page Chapter >> Page >

Evaluating a function given in tabular form

As we saw above, we can represent functions in tables. Conversely, we can use information in tables to write functions, and we can evaluate functions using the tables. For example, how well do our pets recall the fond memories we share with them? There is an urban legend that a goldfish has a memory of 3 seconds, but this is just a myth. Goldfish can remember up to 3 months, while the beta fish has a memory of up to 5 months. And while a puppy’s memory span is no longer than 30 seconds, the adult dog can remember for 5 minutes. This is meager compared to a cat, whose memory span lasts for 16 hours.

The function that relates the type of pet to the duration of its memory span is more easily visualized with the use of a table. See [link] . http://www.kgbanswers.com/how-long-is-a-dogs-memory-span/4221590. Accessed 3/24/2014.

Pet Memory span in hours
Puppy 0.008
Adult dog 0.083
Cat 16
Goldfish 2160
Beta fish 3600

At times, evaluating a function in table form may be more useful than using equations. Here let us call the function P . The domain    of the function is the type of pet and the range is a real number representing the number of hours the pet’s memory span lasts. We can evaluate the function P at the input value of “goldfish.” We would write P ( goldfish ) = 2160. Notice that, to evaluate the function in table form, we identify the input value and the corresponding output value from the pertinent row of the table. The tabular form for function P seems ideally suited to this function, more so than writing it in paragraph or function form.

Given a function represented by a table, identify specific output and input values.

  1. Find the given input in the row (or column) of input values.
  2. Identify the corresponding output value paired with that input value.
  3. Find the given output values in the row (or column) of output values, noting every time that output value appears.
  4. Identify the input value(s) corresponding to the given output value.

Evaluating and solving a tabular function

Using [link] ,

  1. Evaluate g ( 3 ) .
  2. Solve g ( n ) = 6.
n 1 2 3 4 5
g ( n ) 8 6 7 6 8
  1. Evaluating g ( 3 ) means determining the output value of the function g for the input value of n = 3. The table output value corresponding to n = 3 is 7, so g ( 3 ) = 7.
  2. Solving g ( n ) = 6 means identifying the input values, n , that produce an output value of 6. [link] shows two solutions: 2 and 4.
n 1 2 3 4 5
g ( n ) 8 6 7 6 8

When we input 2 into the function g , our output is 6. When we input 4 into the function g , our output is also 6.

Got questions? Get instant answers now!

Using [link] , evaluate g ( 1 ) .

g ( 1 ) = 8

Got questions? Get instant answers now!

Finding function values from a graph

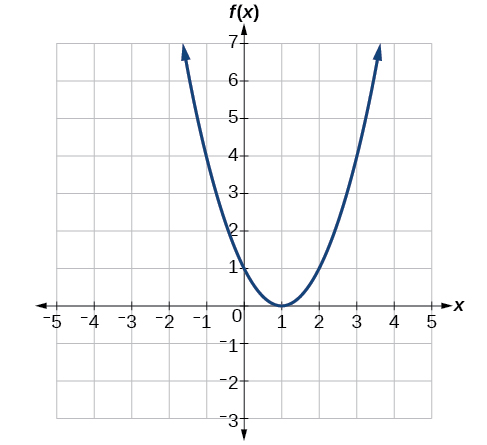
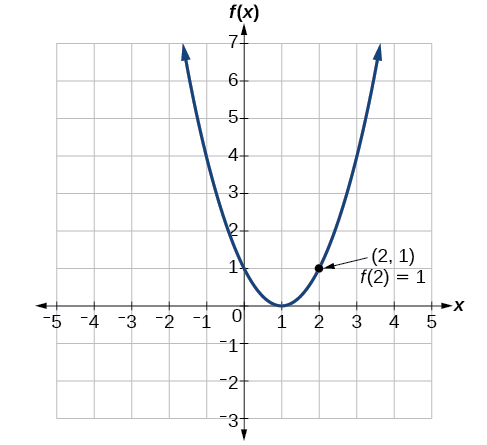
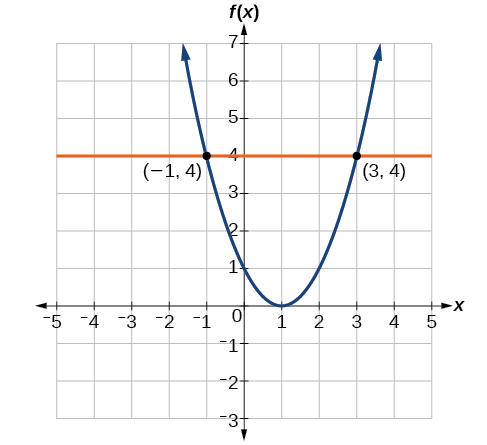
Evaluating a function using a graph also requires finding the corresponding output value for a given input value, only in this case, we find the output value by looking at the graph. Solving a function equation using a graph requires finding all instances of the given output value on the graph and observing the corresponding input value(s).

Reading function values from a graph

Given the graph in [link] ,

  1. Evaluate f ( 2 ) .
  2. Solve f ( x ) = 4.
Graph of a positive parabola centered at (1, 0).
  1. To evaluate f ( 2 ) , locate the point on the curve where x = 2 , then read the y -coordinate of that point. The point has coordinates ( 2 , 1 ) , so f ( 2 ) = 1. See [link] .
    Graph of a positive parabola centered at (1, 0) with the labeled point (2, 1) where f(2) =1.
  2. To solve f ( x ) = 4, we find the output value 4 on the vertical axis. Moving horizontally along the line y = 4 , we locate two points of the curve with output value 4: ( −1 , 4 ) and ( 3 , 4 ) . These points represent the two solutions to f ( x ) = 4: −1 or 3. This means f ( −1 ) = 4 and f ( 3 ) = 4 , or when the input is −1 or 3, the output is 4 . See [link] .
    Graph of an upward-facing parabola with a vertex at (0,1) and labeled points at (-1, 4) and (3,4). A line at y = 4 intersects the parabola at the labeled points.
Got questions? Get instant answers now!

Questions & Answers

what does mean opportunity cost?
Aster Reply
what is poetive effect of population growth
Solomon Reply
what is inflation
Nasir Reply
what is demand
Eleni
what is economics
IMLAN Reply
economics theory describes individual behavior as the result of a process of optimization under constraints the objective to be reached being determined by
Kalkidan
Economics is a branch of social science that deal with How to wise use of resource ,s
Kassie
need
WARKISA
Economic Needs: In economics, needs are goods or services that are necessary for maintaining a certain standard of living. This includes things like healthcare, education, and transportation.
Kalkidan
What is demand and supply
EMPEROR Reply
deman means?
Alex
what is supply?
Alex
ex play supply?
Alex
Money market is a branch or segment of financial market where short-term debt instruments are traded upon. The instruments in this market includes Treasury bills, Bonds, Commercial Papers, Call money among other.
murana Reply
good
Kayode
what is money market
umar Reply
Examine the distinction between theory of comparative cost Advantage and theory of factor proportion
Fatima Reply
What is inflation
Bright Reply
a general and ongoing rise in the level of prices in an economy
AI-Robot
What are the factors that affect demand for a commodity
Florence Reply
price
Kenu
differentiate between demand and supply giving examples
Lambiv Reply
differentiated between demand and supply using examples
Lambiv
what is labour ?
Lambiv
how will I do?
Venny Reply
how is the graph works?I don't fully understand
Rezat Reply
information
Eliyee
devaluation
Eliyee
t
WARKISA
hi guys good evening to all
Lambiv
multiple choice question
Aster Reply
appreciation
Eliyee
explain perfect market
Lindiwe Reply
In economics, a perfect market refers to a theoretical construct where all participants have perfect information, goods are homogenous, there are no barriers to entry or exit, and prices are determined solely by supply and demand. It's an idealized model used for analysis,
Ezea
Got questions? Join the online conversation and get instant answers!
Jobilize.com Reply

Get Jobilize Job Search Mobile App in your pocket Now!

Get it on Google Play Download on the App Store Now


Source:  OpenStax, Algebra and trigonometry. OpenStax CNX. Nov 14, 2016 Download for free at https://legacy.cnx.org/content/col11758/1.6
Google Play and the Google Play logo are trademarks of Google Inc.

Notification Switch

Would you like to follow the 'Algebra and trigonometry' conversation and receive update notifications?

Ask