| << Chapter < Page | Chapter >> Page > |
Use the regression feature to find an exponential function that best fits the data in the table.
Write the exponential function as an exponential equation with base
Use the intersect feature to find the value of for which
For the following exercises, refer to [link] .
| x | f(x) |
| 1 | 5.1 |
| 2 | 6.3 |
| 3 | 7.3 |
| 4 | 7.7 |
| 5 | 8.1 |
| 6 | 8.6 |
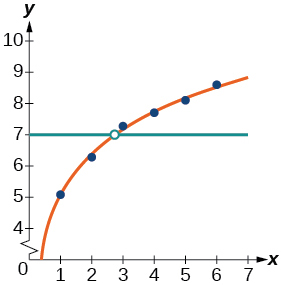
Use a graphing calculator to create a scatter diagram of the data.
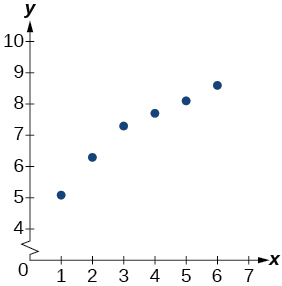
Use the LOGarithm option of the REGression feature to find a logarithmic function of the form that best fits the data in the table.
Use the logarithmic function to find the value of the function when
Graph the logarithmic equation on the scatter diagram.
Use the intersect feature to find the value of for which
When
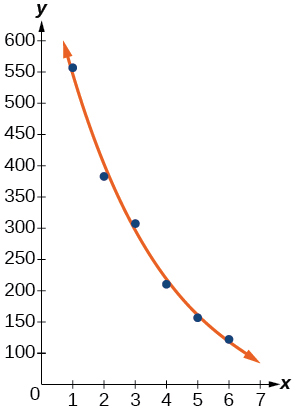
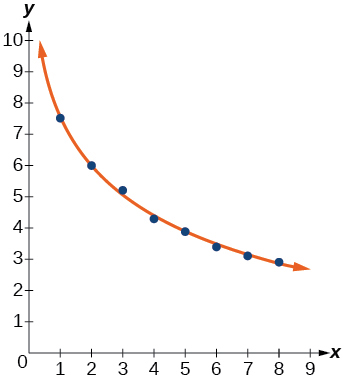
For the following exercises, refer to [link] .
| x | f(x) |
| 1 | 7.5 |
| 2 | 6 |
| 3 | 5.2 |
| 4 | 4.3 |
| 5 | 3.9 |
| 6 | 3.4 |
| 7 | 3.1 |
| 8 | 2.9 |
Use a graphing calculator to create a scatter diagram of the data.
Use the LOGarithm option of the REGression feature to find a logarithmic function of the form that best fits the data in the table.
Use the logarithmic function to find the value of the function when
Use the intersect feature to find the value of for which
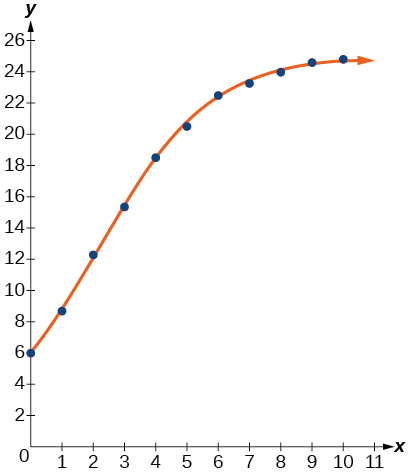
For the following exercises, refer to [link] .
| x | f(x) |
| 1 | 8.7 |
| 2 | 12.3 |
| 3 | 15.4 |
| 4 | 18.5 |
| 5 | 20.7 |
| 6 | 22.5 |
| 7 | 23.3 |
| 8 | 24 |
| 9 | 24.6 |
| 10 | 24.8 |
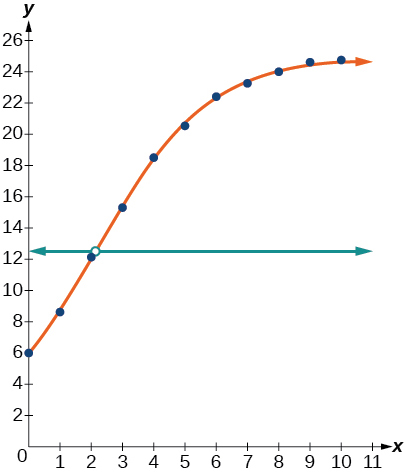
Use a graphing calculator to create a scatter diagram of the data.
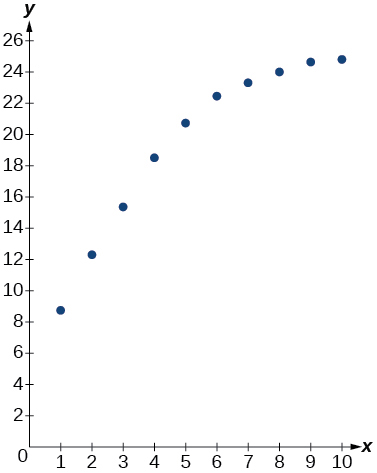
Use the LOGISTIC regression option to find a logistic growth model of the form that best fits the data in the table.
To the nearest whole number, what is the predicted carrying capacity of the model?
Use the intersect feature to find the value of for which the model reaches half its carrying capacity.
When
For the following exercises, refer to [link] .
| 0 | 12 |
| 2 | 28.6 |
| 4 | 52.8 |
| 5 | 70.3 |
| 7 | 99.9 |
| 8 | 112.5 |
| 10 | 125.8 |
| 11 | 127.9 |
| 15 | 135.1 |
| 17 | 135.9 |
Use a graphing calculator to create a scatter diagram of the data.
Use the LOGISTIC regression option to find a logistic growth model of the form that best fits the data in the table.
Graph the logistic equation on the scatter diagram.
To the nearest whole number, what is the predicted carrying capacity of the model?
about
Use the intersect feature to find the value of for which the model reaches half its carrying capacity.
Recall that the general form of a logistic equation for a population is given by such that the initial population at time is Show algebraically that
Working with the left side of the equation, we see that it can be rewritten as
Working with the right side of the equation we show that it can also be rewritten as But first note that when Therefore,
Thus,
Notification Switch
Would you like to follow the 'Algebra and trigonometry' conversation and receive update notifications?

|
|
|
|
|

|
|

|
|

|
|

|
|

|
|

|
|

|
|

|
|

|
|

|