First, we rewrite the conic in standard form by multiplying the numerator and denominator by the reciprocal of 2, which is
Because
so we will graph a
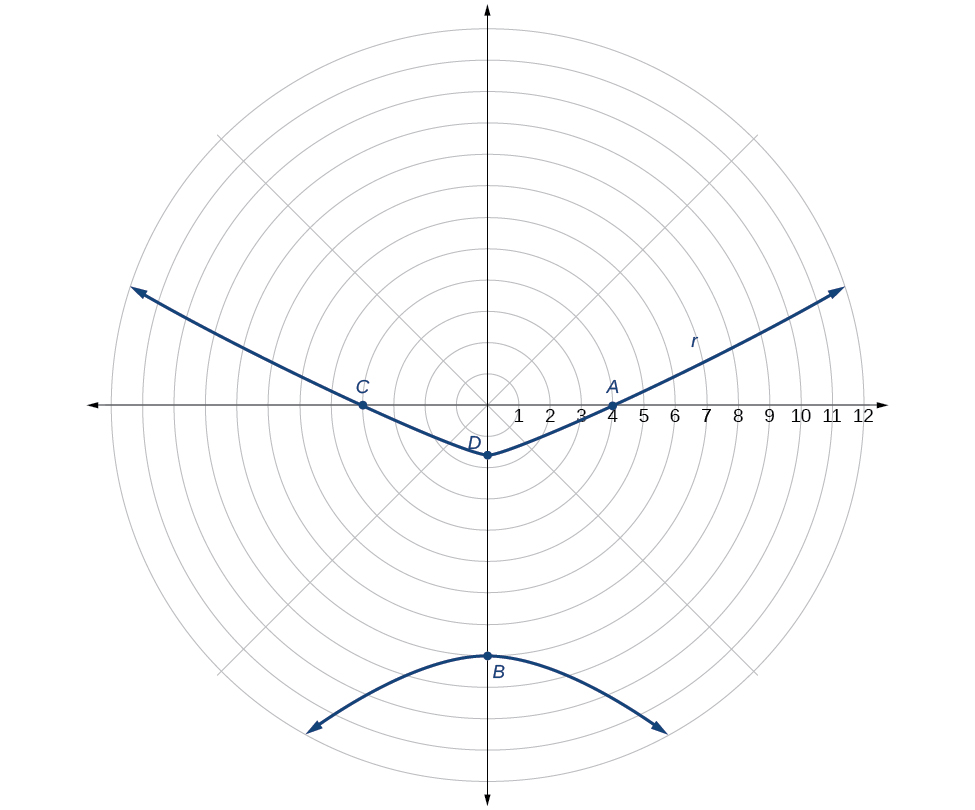
hyperbola with a focus at the origin. The function has a
term and there is a subtraction sign in the denominator, so the directrix is
The directrix is
Plotting a few key points as in
[link] will enable us to see the vertices. See
[link] .
First, we rewrite the conic in standard form by multiplying the numerator and denominator by the reciprocal of 5, which is
Because
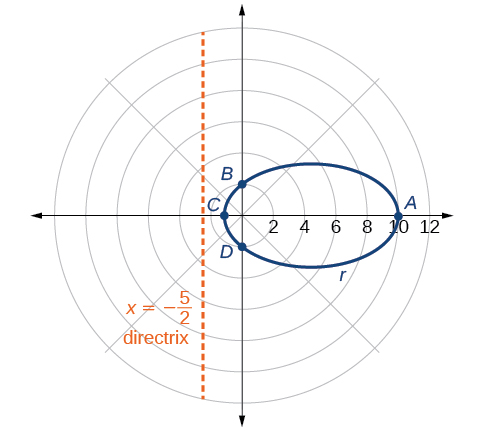
so we will graph an
ellipse with a
focus at the origin. The function has a
and there is a subtraction sign in the denominator, so the
directrix is
The directrix is
Plotting a few key points as in
[link] will enable us to see the vertices. See
[link] .
Defining conics in terms of a focus and a directrix
So far we have been using polar equations of conics to describe and graph the curve. Now we will work in reverse; we will use information about the origin, eccentricity, and directrix to determine the polar equation.
Given the focus, eccentricity, and directrix of a conic, determine the polar equation.
Determine whether the directrix is horizontal or vertical. If the directrix is given in terms of
we use the general polar form in terms of sine. If the directrix is given in terms of
we use the general polar form in terms of cosine.
Determine the sign in the denominator. If
use subtraction. If
use addition.
Write the coefficient of the trigonometric function as the given eccentricity.
Write the absolute value of
in the numerator, and simplify the equation.
Finding the polar form of a vertical conic given a focus at the origin and the eccentricity and directrix
Find the polar form of the
conic given a
focus at the origin,
and
directrix
The directrix is
so we know the trigonometric function in the denominator is sine.
Because
so we know there is a subtraction sign in the denominator. We use the standard form of
Finding the polar form of a horizontal conic given a focus at the origin and the eccentricity and directrix
Find the
polar form of a conic given a
focus at the origin,
and
directrix
Because the directrix is
we know the function in the denominator is cosine. Because
so we know there is an addition sign in the denominator. We use the standard form of
is it possible to leave every good at the same level
Joseph
I don't think so. because check it, if the demand for chicken increases, people will no longer consume fish like they used to causing a fall in the demand for fish
Anuolu
is not really possible to let the value of a goods to be same at the same time.....
Salome
Suppose the inflation rate is 6%, does it mean that all the goods you purchase will cost
6% more than previous year? Provide with reasoning.
Not necessarily. To measure the inflation rate economists normally use an averaged price index of a basket of certain goods. So if you purchase goods included in the basket, you will notice that you pay 6% more, otherwise not necessarily.
Good day
How do I calculate this question: C= 100+5yd G= 2000 T= 2000 I(planned)=200.
Suppose the actual output is 3000. What is the level of planned expenditures at this level of output?
I am Camara from Guinea west Africa... happy to meet you guys here
Sekou
ma management ho
Amisha
ahile becheclor ho
Amisha
hjr ktm bta ho
ani k kaam grnu hunxa tw
Amisha
belatari
Amisha
1st year ho
Amisha
nd u
Amisha
ahh
Amisha
kaha biratnagar
Amisha
ys
Amisha
kina k vo
Amisha
money as unit of account means what?
Kalombe
A unit of account is something that can be used to value goods and services and make calculations
Jim
all of you please speak in English I can't understand you're language
Muhammad
I want to know how can we define macroeconomics in one line
Muhammad
it must be .9 or 0.9
no Mpc is greater than 1
Y=100+.9Y+50
Y-.9Y=150
0.1Y/0.1=150/0.1
Y=1500
Kalombe
Mercy is it clear?😋
Kalombe
hi can someone help me on this question
If a negative shocks shifts the IS curve to the left, what type of policy do you suggest so as to stabilize the level of output?
discuss your answer using appropriate graph.