<< Chapter < Page Chapter >> Page >

Construct a probability model for tossing a fair coin.

Outcome Probability
Roll of 1
Roll of 2
Roll of 3
Roll of 4
Roll of 5
Roll of 6
Got questions? Get instant answers now!

Computing probabilities of equally likely outcomes

Let S be a sample space for an experiment. When investigating probability, an event is any subset of S . When the outcomes of an experiment are all equally likely, we can find the probability of an event by dividing the number of outcomes in the event by the total number of outcomes in S . Suppose a number cube is rolled, and we are interested in finding the probability of the event “rolling a number less than or equal to 4.” There are 4 possible outcomes in the event and 6 possible outcomes in S , so the probability of the event is 4 6 = 2 3 .

Computing the probability of an event with equally likely outcomes

The probability of an event E in an experiment with sample space S with equally likely outcomes is given by

P ( E ) = number of elements in  E number of elements in  S = n ( E ) n ( S )

E is a subset of S , so it is always true that 0 P ( E ) 1.

Computing the probability of an event with equally likely outcomes

A number cube is rolled. Find the probability of rolling an odd number.

The event “rolling an odd number” contains three outcomes. There are 6 equally likely outcomes in the sample space. Divide to find the probability of the event.

P ( E ) = 3 6 = 1 2
Got questions? Get instant answers now!

A number cube is rolled. Find the probability of rolling a number greater than 2.

2 3

Got questions? Get instant answers now!

Computing the probability of the union of two events

We are often interested in finding the probability that one of multiple events occurs. Suppose we are playing a card game, and we will win if the next card drawn is either a heart or a king. We would be interested in finding the probability of the next card being a heart or a king. The union of two events     E  and  F , written  E F , is the event that occurs if either or both events occur.

P ( E F ) = P ( E ) + P ( F ) P ( E F )

Suppose the spinner in [link] is spun. We want to find the probability of spinning orange or spinning a b .

A pie chart with six pieces with two a's colored orange, one b colored orange and another b colored red, one d colored blue, and one c colored green.

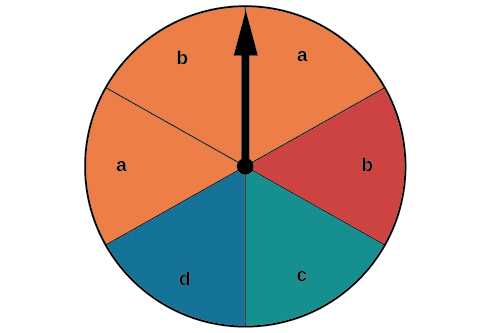
There are a total of 6 sections, and 3 of them are orange. So the probability of spinning orange is 3 6 = 1 2 . There are a total of 6 sections, and 2 of them have a b . So the probability of spinning a b is 2 6 = 1 3 . If we added these two probabilities, we would be counting the sector that is both orange and a b twice. To find the probability of spinning an orange or a b , we need to subtract the probability that the sector is both orange and has a b .

1 2 + 1 3 1 6 = 2 3

The probability of spinning orange or a b is 2 3 .

Probability of the union of two events

The probability of the union of two events E and F (written E F ) equals the sum of the probability of E and the probability of F minus the probability of E and F occurring together ( which is called the intersection of E and F and is written as E F ).

P ( E F ) = P ( E ) + P ( F ) P ( E F )

Computing the probability of the union of two events

A card is drawn from a standard deck. Find the probability of drawing a heart or a 7.

A standard deck contains an equal number of hearts, diamonds, clubs, and spades. So the probability of drawing a heart is 1 4 . There are four 7s in a standard deck, and there are a total of 52 cards. So the probability of drawing a 7 is 1 13 .

The only card in the deck that is both a heart and a 7 is the 7 of hearts, so the probability of drawing both a heart and a 7 is 1 52 . Substitute P ( H ) = 1 4 ,   P ( 7 ) = 1 13 ,   and   P ( H 7 ) = 1 52 into the formula.

P ( E F ) = P ( E ) + P ( F ) P ( E F )                 = 1 4 + 1 13 1 52                 = 4 13

The probability of drawing a heart or a 7 is 4 13 .

Got questions? Get instant answers now!

Questions & Answers

how do you get the 2/50
Abba Reply
number of sport play by 50 student construct discrete data
Aminu Reply
width of the frangebany leaves on how to write a introduction
Theresa Reply
Solve the mean of variance
Veronica Reply
Step 1: Find the mean. To find the mean, add up all the scores, then divide them by the number of scores. ... Step 2: Find each score's deviation from the mean. ... Step 3: Square each deviation from the mean. ... Step 4: Find the sum of squares. ... Step 5: Divide the sum of squares by n – 1 or N.
kenneth
what is error
Yakuba Reply
Is mistake done to something
Vutshila
Hy
anas
hy
What is the life teble
anas
hy
Jibrin
statistics is the analyzing of data
Tajudeen Reply
what is statics?
Zelalem Reply
how do you calculate mean
Gloria Reply
diveving the sum if all values
Shaynaynay
let A1,A2 and A3 events be independent,show that (A1)^c, (A2)^c and (A3)^c are independent?
Fisaye Reply
what is statistics
Akhisani Reply
data collected all over the world
Shaynaynay
construct a less than and more than table
Imad Reply
The sample of 16 students is taken. The average age in the sample was 22 years with astandard deviation of 6 years. Construct a 95% confidence interval for the age of the population.
Aschalew Reply
Bhartdarshan' is an internet-based travel agency wherein customer can see videos of the cities they plant to visit. The number of hits daily is a normally distributed random variable with a mean of 10,000 and a standard deviation of 2,400 a. what is the probability of getting more than 12,000 hits? b. what is the probability of getting fewer than 9,000 hits?
Akshay Reply
Bhartdarshan'is an internet-based travel agency wherein customer can see videos of the cities they plan to visit. The number of hits daily is a normally distributed random variable with a mean of 10,000 and a standard deviation of 2,400. a. What is the probability of getting more than 12,000 hits
Akshay
1
Bright
Sorry i want to learn more about this question
Bright
Someone help
Bright
a= 0.20233 b=0.3384
Sufiyan
a
Shaynaynay
How do I interpret level of significance?
Mohd Reply
It depends on your business problem or in Machine Learning you could use ROC- AUC cruve to decide the threshold value
Shivam
how skewness and kurtosis are used in statistics
Owen Reply
yes what is it
Taneeya
Got questions? Join the online conversation and get instant answers!
Jobilize.com Reply
Practice Key Terms 9

Get Jobilize Job Search Mobile App in your pocket Now!

Get it on Google Play Download on the App Store Now


Source:  OpenStax, Algebra and trigonometry. OpenStax CNX. Nov 14, 2016 Download for free at https://legacy.cnx.org/content/col11758/1.6
Google Play and the Google Play logo are trademarks of Google Inc.

Notification Switch

Would you like to follow the 'Algebra and trigonometry' conversation and receive update notifications?

Ask