INTERPRETATION OF THE SLOPE: The slope of the best-fit line tells us how the dependent variable (
y ) changes for every one unit increase in the independent (
x ) variable, on average.
Third exam vs final exam example
Slope: The slope of the line is
b = 4.83.
Interpretation: For a one-point increase in the score on the third exam, the final exam score increases by 4.83 points, on average.
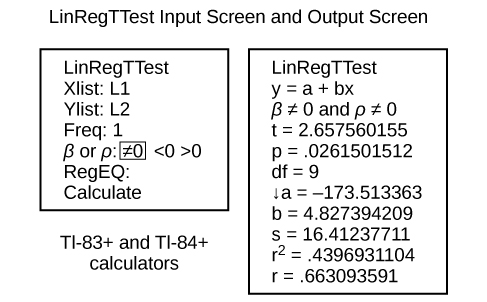
Using the Linear Regression T Test: LinRegTTest
In the STAT list editor, enter the X data in list L1 and the Y data in list L2, paired so that the corresponding (
x ,
y ) values are next to each other in the lists. (If a particular pair of values is repeated, enter it as many times as it appears in the data.)
On the STAT TESTS menu, scroll down with the cursor to select the LinRegTTest. (Be careful to select LinRegTTest, as some calculators may also have a different item called LinRegTInt.)
On the LinRegTTest input screen enter: Xlist: L1 ; Ylist: L2 ; Freq: 1
On the next line, at the prompt
β or
ρ , highlight "≠ 0" and press ENTER
Leave the line for "RegEq:" blank
Highlight Calculate and press ENTER.
The output screen contains a lot of information. For now we will focus on a few items from the output, and will return later to the other items.
The second line says
y =
a +
bx . Scroll down to find the values
a = –173.513, and
b = 4.8273; the equation of the best fit line is
ŷ = –173.51 + 4.83
x The two items at the bottom are
r2 = 0.43969 and
r = 0.663. For now, just note where to find these values; we will discuss them in the next two sections.
Graphing the Scatterplot and Regression Line
We are assuming your X data is already entered in list L1 and your Y data is in list L2
Press 2nd STATPLOT ENTER to use Plot 1
On the input screen for PLOT 1, highlight
On , and press ENTER
For TYPE: highlight the very first icon which is the scatterplot and press ENTER
Indicate Xlist: L1 and Ylist: L2
For Mark: it does not matter which symbol you highlight.
Press the ZOOM key and then the number 9 (for menu item "ZoomStat") ; the calculator will fit the window to the data
To graph the best-fit line, press the "Y=" key and type the equation –173.5 + 4.83X into equation Y1. (The X key is immediately left of the STAT key). Press ZOOM 9 again to graph it.
Optional: If you want to change the viewing window, press the WINDOW key. Enter your desired window using Xmin, Xmax, Ymin, Ymax
Note
Another way to graph the line after you create a scatter plot is to use LinRegTTest.
Make sure you have done the scatter plot. Check it on your screen.
Go to LinRegTTest and enter the lists.
At RegEq: press VARS and arrow over to Y-VARS. Press 1 for 1:Function. Press 1 for 1:Y1. Then arrow down to Calculate and do the calculation for the line of best fit.
Press Y = (you will see the regression equation).
Press GRAPH. The line will be drawn."
The correlation coefficient
r
Besides looking at the scatter plot and seeing that a line seems reasonable, how can you tell if the line is a good predictor? Use the correlation coefficient as another indicator (besides the scatterplot) of the strength of the relationship between
x and
y .
Bacteria doesn't produce energy they are dependent upon their substrate in case of lack of nutrients they are able to make spores which helps them to sustain in harsh environments
_Adnan
But not all bacteria make spores, l mean Eukaryotic cells have Mitochondria which acts as powerhouse for them, since bacteria don't have it, what is the substitution for it?
Assimilatory nitrate reduction is a process that occurs in some microorganisms, such as bacteria and archaea, in which nitrate (NO3-) is reduced to nitrite (NO2-), and then further reduced to ammonia (NH3).
Elkana
This process is called assimilatory nitrate reduction because the nitrogen that is produced is incorporated in the cells of microorganisms where it can be used in the synthesis of amino acids and other nitrogen products
There are nothing like emergency disease but there are some common medical emergency which can occur simultaneously like Bleeding,heart attack,Breathing difficulties,severe pain heart stock.Hope you will get my point .Have a nice day ❣️
_Adnan
define infection ,prevention and control
Innocent
I think infection prevention and control is the avoidance of all things we do that gives out break of infections and promotion of health practices that promote life