<< Chapter < Page Chapter >> Page >

Try it

The following data are the number of pages in 40 books on a shelf. Construct a box plot using a graphing calculator, and state the interquartile range.
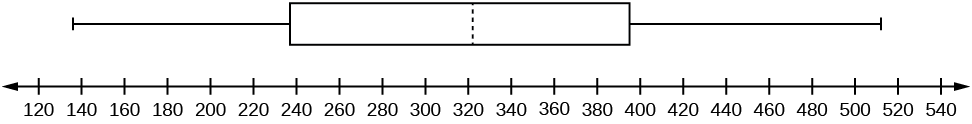
  • 136
  • 140
  • 178
  • 190
  • 205
  • 215
  • 217
  • 218
  • 232
  • 234
  • 240
  • 255
  • 270
  • 275
  • 290
  • 301
  • 303
  • 315
  • 317
  • 318
  • 326
  • 333
  • 343
  • 349
  • 360
  • 369
  • 377
  • 388
  • 391
  • 392
  • 398
  • 400
  • 402
  • 405
  • 408
  • 422
  • 429
  • 450
  • 475
  • 512

IQR = 158

Got questions? Get instant answers now!

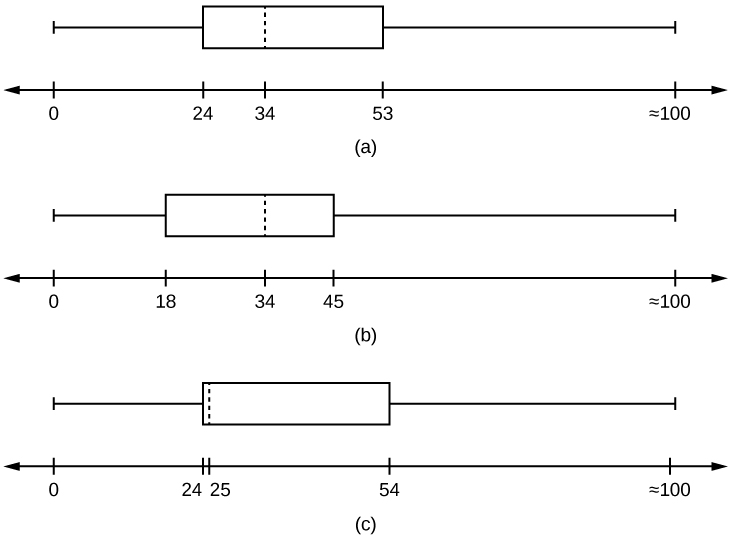
For some sets of data, some of the largest value, smallest value, first quartile, median, and third quartile may be the same. For instance, you might have a data set in which the median and the third quartile are the same. In this case, the diagram would not have a dotted line inside the box displaying the median. The right side of the box would display both the third quartile and the median. For example, if the smallest value and the first quartile were both one, the median and the third quartile were both five, and the largest value was seven, the box plot would look like:

Horizontal boxplot box begins at the smallest value and Q1, 1, until the Q3 and median, 5, no median line is designated, and has its lone whisker extending from the Q3 to the largest value, 7.

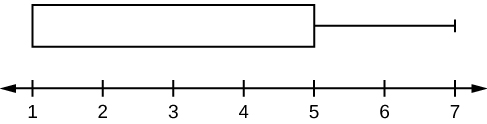
In this case, at least 25% of the values are equal to one. Twenty-five percent of the values are between one and five, inclusive. At least 25% of the values are equal to five. The top 25% of the values fall between five and seven, inclusive.

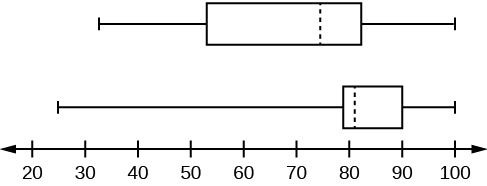
Test scores for a college statistics class held during the day are:

  • 99
  • 56
  • 78
  • 55.5
  • 32
  • 90
  • 80
  • 81
  • 56
  • 59
  • 45
  • 77
  • 84.5
  • 84
  • 70
  • 72
  • 68
  • 32
  • 79
  • 90

Test scores for a college statistics class held during the evening are:

  • 98
  • 78
  • 68
  • 83
  • 81
  • 89
  • 88
  • 76
  • 65
  • 45
  • 98
  • 90
  • 80
  • 84.5
  • 85
  • 79
  • 78
  • 98
  • 90
  • 79
  • 81
  • 25.5

  1. Find the smallest and largest values, the median, and the first and third quartile for the day class.
  2. Find the smallest and largest values, the median, and the first and third quartile for the night class.
  3. For each data set, what percentage of the data is between the smallest value and the first quartile? the first quartile and the median? the median and the third quartile? the third quartile and the largest value? What percentage of the data is between the first quartile and the largest value?
  4. Create a box plot for each set of data. Use one number line for both box plots.
  5. Which box plot has the widest spread for the middle 50% of the data (the data between the first and third quartiles)? What does this mean for that set of data in comparison to the other set of data?
    • Min = 32
    • Q 1 = 56
    • M = 74.5
    • Q 3 = 82.5
    • Max = 99
    • Min = 25.5
    • Q 1 = 78
    • M = 81
    • Q 3 = 89
    • Max = 98
  1. Day class: There are six data values ranging from 32 to 56: 30%. There are six data values ranging from 56 to 74.5: 30%. There are five data values ranging from 74.5 to 82.5: 25%. There are five data values ranging from 82.5 to 99: 25%. There are 16 data values between the first quartile, 56, and the largest value, 99: 75%. Night class:
  2. Two box plots over a number line from 0 to 100.  The top plot shows a whisker from 32 to 56, a solid line at 56, a dashed line at 74.5, a solid line at 82.5, and a whisker from 82.5 to 99.  The lower plot shows a whisker from 25.5 to 78, solid line at 78, dashed line at 81, solid line at 89, and a whisker from 89 to 98.
  3. The first data set has the wider spread for the middle 50% of the data. The IQR for the first data set is greater than the IQR for the second set. This means that there is more variability in the middle 50% of the first data set.
Got questions? Get instant answers now!

Try it

The following data set shows the heights in inches for the boys in a class of 40 students.

66; 66; 67; 67; 68; 68; 68; 68; 68; 69; 69; 69; 70; 71; 72; 72; 72; 73; 73; 74
The following data set shows the heights in inches for the girls in a class of 40 students.
61; 61; 62; 62; 63; 63; 63; 65; 65; 65; 66; 66; 66; 67; 68; 68; 68; 69; 69; 69
Construct a box plot using a graphing calculator for each data set, and state which box plot has the wider spread for the middle 50% of the data.

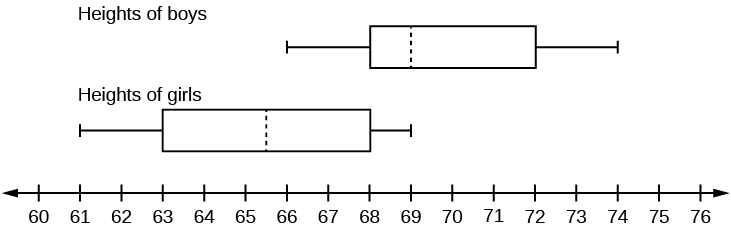
IQR for the boys = 4

IQR for the girls = 5

The box plot for the heights of the girls has the wider spread for the middle 50% of the data.

Got questions? Get instant answers now!

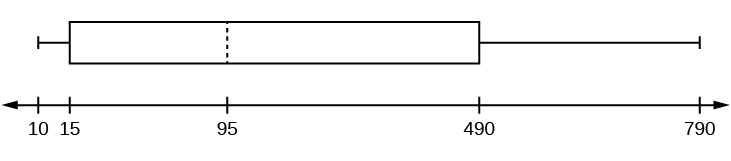
Graph a box-and-whisker plot for the data values shown.

  • 10
  • 10
  • 10
  • 15
  • 35
  • 75
  • 90
  • 95
  • 100
  • 175
  • 420
  • 490
  • 515
  • 515
  • 790

The five numbers used to create a box-and-whisker plot are:

  • Min: 10
  • Q 1 : 15
  • Med: 95
  • Q 3 : 490
  • Max: 790

The following graph shows the box-and-whisker plot.

Got questions? Get instant answers now!

Try it

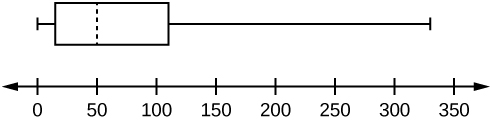
Follow the steps you used to graph a box-and-whisker plot for the data values shown.

  • 0
  • 5
  • 5
  • 15
  • 30
  • 30
  • 45
  • 50
  • 50
  • 60
  • 75
  • 110
  • 140
  • 240
  • 330

The data are in order from least to greatest. There are 15 values, so the eighth number in order is the median: 50. There are seven data values written to the left of the median and 7 values to the right. The five values that are used to create the boxplot are:

  • Min: 0
  • Q 1 : 15
  • Med: 50
  • Q 3 : 110
  • Max: 330
Got questions? Get instant answers now!

References

Data from West Magazine .

Chapter review

Box plots are a type of graph that can help visually organize data. To graph a box plot the following data points must be calculated: the minimum value, the first quartile, the median, the third quartile, and the maximum value. Once the box plot is graphed, you can display and compare distributions of data.

Sixty-five randomly selected car salespersons were asked the number of cars they generally sell in one week. Fourteen people answered that they generally sell three cars; nineteen generally sell four cars; twelve generally sell five cars; nine generally sell six cars; eleven generally sell seven cars.

Construct a box plot below. Use a ruler to measure and scale accurately.

Got questions? Get instant answers now!

Looking at your box plot, does it appear that the data are concentrated together, spread out evenly, or concentrated in some areas, but not in others? How can you tell?

More than 25% of salespersons sell four cars in a typical week. You can see this concentration in the box plot because the first quartile is equal to the median. The top 25% and the bottom 25% are spread out evenly; the whiskers have the same length.

Got questions? Get instant answers now!

Bringing it together

Santa Clara County, CA, has approximately 27,873 Japanese-Americans. Their ages are as follows:

Age Group Percent of Community
0–17 18.9
18–24 8.0
25–34 22.8
35–44 15.0
45–54 13.1
55–64 11.9
65+ 10.3
  1. Construct a histogram of the Japanese-American community in Santa Clara County, CA. The bars will not be the same width for this example. Why not? What impact does this have on the reliability of the graph?
  2. What percentage of the community is under age 35?
  3. Which box plot most resembles the information above?
Three box plots with values between 0 and 100.  Plot i has Q1 at 24, M at 34, and Q3 at 53; Plot ii has Q1 at 18, M at 34, and Q3 at 45; Plot iii has Q1 at 24, M at 25, and Q3 at 54.
  1. For graph, check student's solution.
  2. 49.7% of the community is under the age of 35.
  3. Based on the information in the table, graph (a) most closely represents the data.
Got questions? Get instant answers now!

Questions & Answers

Three charges q_{1}=+3\mu C, q_{2}=+6\mu C and q_{3}=+8\mu C are located at (2,0)m (0,0)m and (0,3) coordinates respectively. Find the magnitude and direction acted upon q_{2} by the two other charges.Draw the correct graphical illustration of the problem above showing the direction of all forces.
Kate Reply
To solve this problem, we need to first find the net force acting on charge q_{2}. The magnitude of the force exerted by q_{1} on q_{2} is given by F=\frac{kq_{1}q_{2}}{r^{2}} where k is the Coulomb constant, q_{1} and q_{2} are the charges of the particles, and r is the distance between them.
Muhammed
What is the direction and net electric force on q_{1}= 5µC located at (0,4)r due to charges q_{2}=7mu located at (0,0)m and q_{3}=3\mu C located at (4,0)m?
Kate Reply
what is the change in momentum of a body?
Eunice Reply
what is a capacitor?
Raymond Reply
Capacitor is a separation of opposite charges using an insulator of very small dimension between them. Capacitor is used for allowing an AC (alternating current) to pass while a DC (direct current) is blocked.
Gautam
A motor travelling at 72km/m on sighting a stop sign applying the breaks such that under constant deaccelerate in the meters of 50 metres what is the magnitude of the accelerate
Maria Reply
please solve
Sharon
8m/s²
Aishat
What is Thermodynamics
Muordit
velocity can be 72 km/h in question. 72 km/h=20 m/s, v^2=2.a.x , 20^2=2.a.50, a=4 m/s^2.
Mehmet
A boat travels due east at a speed of 40meter per seconds across a river flowing due south at 30meter per seconds. what is the resultant speed of the boat
Saheed Reply
50 m/s due south east
Someone
which has a higher temperature, 1cup of boiling water or 1teapot of boiling water which can transfer more heat 1cup of boiling water or 1 teapot of boiling water explain your . answer
Ramon Reply
I believe temperature being an intensive property does not change for any amount of boiling water whereas heat being an extensive property changes with amount/size of the system.
Someone
Scratch that
Someone
temperature for any amount of water to boil at ntp is 100⁰C (it is a state function and and intensive property) and it depends both will give same amount of heat because the surface available for heat transfer is greater in case of the kettle as well as the heat stored in it but if you talk.....
Someone
about the amount of heat stored in the system then in that case since the mass of water in the kettle is greater so more energy is required to raise the temperature b/c more molecules of water are present in the kettle
Someone
definitely of physics
Haryormhidey Reply
how many start and codon
Esrael Reply
what is field
Felix Reply
physics, biology and chemistry this is my Field
ALIYU
field is a region of space under the influence of some physical properties
Collete
what is ogarnic chemistry
WISDOM Reply
determine the slope giving that 3y+ 2x-14=0
WISDOM
Another formula for Acceleration
Belty Reply
a=v/t. a=f/m a
IHUMA
innocent
Adah
pratica A on solution of hydro chloric acid,B is a solution containing 0.5000 mole ofsodium chlorid per dm³,put A in the burret and titrate 20.00 or 25.00cm³ portion of B using melting orange as the indicator. record the deside of your burret tabulate the burret reading and calculate the average volume of acid used?
Nassze Reply
how do lnternal energy measures
Esrael
Two bodies attract each other electrically. Do they both have to be charged? Answer the same question if the bodies repel one another.
JALLAH Reply
No. According to Isac Newtons law. this two bodies maybe you and the wall beside you. Attracting depends on the mass och each body and distance between them.
Dlovan
Are you really asking if two bodies have to be charged to be influenced by Coulombs Law?
Robert
like charges repel while unlike charges atttact
Raymond
What is specific heat capacity
Destiny Reply
Specific heat capacity is a measure of the amount of energy required to raise the temperature of a substance by one degree Celsius (or Kelvin). It is measured in Joules per kilogram per degree Celsius (J/kg°C).
AI-Robot
specific heat capacity is the amount of energy needed to raise the temperature of a substance by one degree Celsius or kelvin
ROKEEB
Got questions? Join the online conversation and get instant answers!
Jobilize.com Reply

Get Jobilize Job Search Mobile App in your pocket Now!

Get it on Google Play Download on the App Store Now


Source:  OpenStax, Introductory statistics. OpenStax CNX. May 06, 2016 Download for free at http://legacy.cnx.org/content/col11562/1.18
Google Play and the Google Play logo are trademarks of Google Inc.

Notification Switch

Would you like to follow the 'Introductory statistics' conversation and receive update notifications?

Ask