

| << Chapter < Page | Chapter >> Page > |
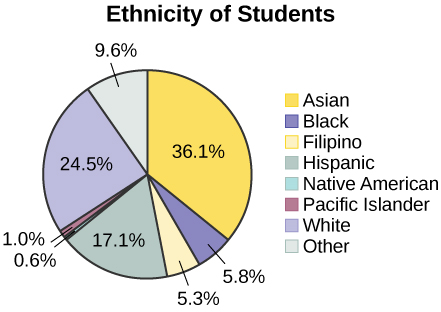
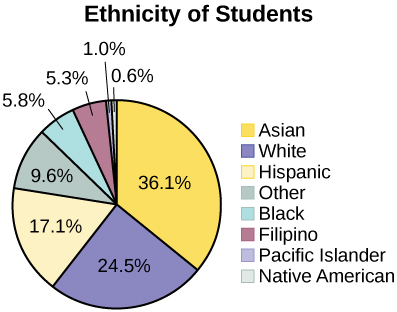
The following pie charts have the “Other/Unknown” category included (since the percentages must add to 100%). The chart in [link] is organized by the size of each wedge, which makes it a more visually informative graph than the unsorted, alphabetical graph in [link] .
Gathering information about an entire population often costs too much or is virtually impossible. Instead, we use a sample of the population. A sample should have the same characteristics as the population it is representing. Most statisticians use various methods of random sampling in an attempt to achieve this goal. This section will describe a few of the most common methods. There are several different methods of random sampling . In each form of random sampling, each member of a population initially has an equal chance of being selected for the sample. Each method has pros and cons. The easiest method to describe is called a simple random sample . Any group of n individuals is equally likely to be chosen by any other group of n individuals if the simple random sampling technique is used. In other words, each sample of the same size has an equal chance of being selected. For example, suppose Lisa wants to form a four-person study group (herself and three other people) from her pre-calculus class, which has 31 members not including Lisa. To choose a simple random sample of size three from the other members of her class, Lisa could put all 31 names in a hat, shake the hat, close her eyes, and pick out three names. A more technological way is for Lisa to first list the last names of the members of her class together with a two-digit number, as in [link] :
| ID | Name | ID | Name | ID | Name |
|---|---|---|---|---|---|
| 00 | Anselmo | 11 | King | 21 | Roquero |
| 01 | Bautista | 12 | Legeny | 22 | Roth |
| 02 | Bayani | 13 | Lundquist | 23 | Rowell |
| 03 | Cheng | 14 | Macierz | 24 | Salangsang |
| 04 | Cuarismo | 15 | Motogawa | 25 | Slade |
| 05 | Cuningham | 16 | Okimoto | 26 | Stratcher |
| 06 | Fontecha | 17 | Patel | 27 | Tallai |
| 07 | Hong | 18 | Price | 28 | Tran |
| 08 | Hoobler | 19 | Quizon | 29 | Wai |
| 09 | Jiao | 20 | Reyes | 30 | Wood |
| 10 | Khan |
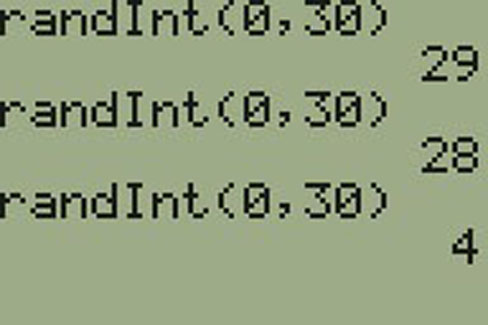
Lisa can use a table of random numbers (found in many statistics books and mathematical handbooks), a calculator, or a computer to generate random numbers. For this example, suppose Lisa chooses to generate random numbers from a calculator. The numbers generated are as follows:
Lisa reads two-digit groups until she has chosen three class members (that is, she reads 0.94360 as the groups 94, 43, 36, 60). Each random number may only contribute one class member. If she needed to, Lisacould have generated more random numbers.
The random numbers 0.94360 and 0.99832 do not contain appropriate two digit numbers. However the third random number, 0.14669, contains 14 (the fourth random number also contains 14), the fifth random number contains 05, and the seventh random number contains 04. The two-digit number 14 corresponds to Macierz, 05 corresponds to Cuningham, and 04 corresponds to Cuarismo. Besides herself, Lisa’s group will consist of Marcierz, Cuningham, and Cuarismo.
To generate random numbers:
Note: randInt(0, 30, 3) will generate 3 random numbers.
Notification Switch
Would you like to follow the 'Introductory statistics' conversation and receive update notifications?

|
|
|
|
|

|
|

|
|

|
|

|
|
|
|
|

|
|

|
|
|
|
|

|
|
|
|